Technical analyses - VANTIVA - English
You are currently viewing all technical analyses of the financial instrument VANTIVA regarding all markets in English regarding all markets, sorted by Latest comments.
Sort : Latest comments | Latest posted
- 0
- 96200
- 15874
- 0

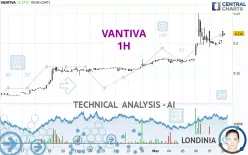
Timeframe : 1H - Simple chart
Status : TARGET REACHED
- 0
- 96200
- 15874
- 0
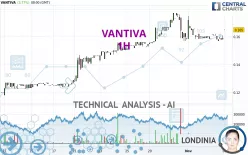
Timeframe : 1H - Simple chart
Status : INVALID
- 0
- 96200
- 15874
- 0
Timeframe : 1H - Simple chart
Status : INVALID
- 0
- 96200
- 15874
- 0

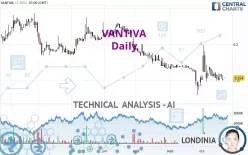
Timeframe : Daily - Simple chart
Status : INVALID
- 0
- 96200
- 15874
- 0
Timeframe : Daily - Simple chart
Status : TARGET REACHED
- 0
- 96200
- 15874
- 0

Timeframe : Daily - Simple chart
Status : TARGET REACHED
- 0
- 96200
- 15874
- 0

Timeframe : 1H - Simple chart
Status : INVALID
- 0
- 96200
- 15874
- 0

Timeframe : 1H - Simple chart
Status : INVALID
- 0
- 96200
- 15874
- 0

Timeframe : Daily - Simple chart
Status : NEUTRAL
- 0
- 96200
- 15874
- 0

Timeframe : Daily - Simple chart
Status : WITHOUT TARGET
- 0
- 96200
- 15874
- 0

Timeframe : 1H - Simple chart
Status : INVALID
- 22
- 92
- 270
- 94

Timeframe : Monthly - Chart + Trading signal

