VANTIVA - Daily - Technical analysis published on 10/23/2023 (GMT)
- 229
- 0
Click here for a new analysis!
- Timeframe : Daily
- - Analysis generated on
- Status : TARGET REACHED
Summary of the analysis

Additional analysis
Quotes
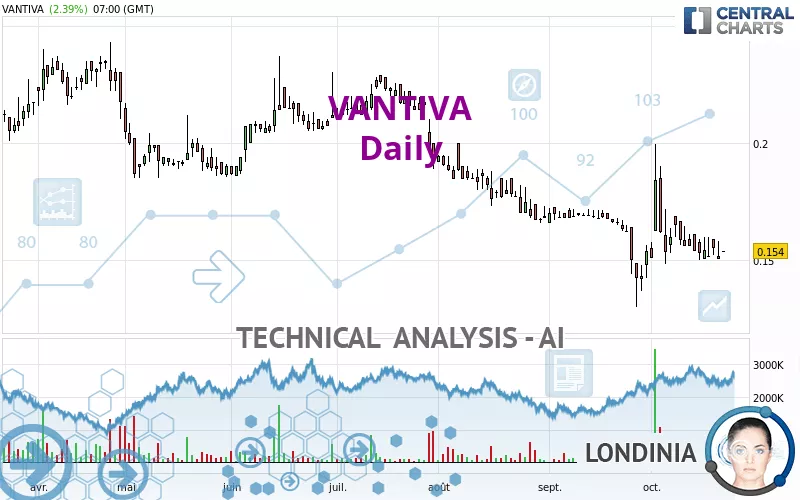
The VANTIVA price is 0.1540 EUR. On the day, this instrument gained +2.39% and was between 0.1540 EUR and 0.1540 EUR. This implies that the price is at 0% from its lowest and at 0% from its highest.The Central Gaps scanner detects a bullish opening. A small advantage for buyers in the very short term.
Bullish opening
Type : Bullish
Timeframe : Openning
Opening Gap DOWN
Type : Bearish
Timeframe : Openning
Here is a more detailed summary of the historical variations registered by VANTIVA:
Technical
Technical analysis of this Daily chart of VANTIVA indicates that the overall trend is strongly bearish. 92.86% of the signals given by moving averages are bearish. This strongly bearish trend is supported by the strong bearish signals given by short-term moving averages. An assessment of moving averages reveals a bearish signal that could impact this trend:
Bearish price crossover with adaptative moving average 20
Type : Bearish
Timeframe : Daily
On the 18 technical indicators analysed, 4 are bullish, 7 are neutral and 7 are bearish. Caution: the Central Indicators scanner currently detects an excess:
Williams %R indicator is oversold : under -80
Type : Neutral
Timeframe : Daily
Pivot points : price is under support 1
Type : Neutral
Timeframe : Daily
Aroon indicator bearish trend
Type : Bearish
Timeframe : Daily
No signals are given by Central Patterns, a market scanner specialised in chart patterns, resistances and supports.
The Central Candlesticks scanner currently notes the presence of this pattern in Japanese candlesticks that could mark the end of the short-term trend currently underway:
Black hanging man / hammer
Type : Neutral
Timeframe : Daily
| S1 | Price | R1 | R2 | R3 | |
|---|---|---|---|---|---|
| ProTrendLines | 0.1422 | 0.1540 | 0.1675 | 0.1868 | 0.2101 |
| Change (%) | -7.66% | - | +8.77% | +21.30% | +36.43% |
| Change | -0.0118 | - | +0.0135 | +0.0328 | +0.0561 |
| Level | Intermediate | - | Minor | Intermediate | Minor |
Attention could also be paid to pivot points to set price objectives:
| Pivot points | S3 | S2 | S1 | PP | R1 | R2 | R3 |
|---|---|---|---|---|---|---|---|
| Standard | 0.1403 | 0.1453 | 0.1479 | 0.1529 | 0.1555 | 0.1605 | 0.1631 |
| Camarilla | 0.1483 | 0.1490 | 0.1497 | 0.1504 | 0.1511 | 0.1518 | 0.1525 |
| Woodie | 0.1390 | 0.1447 | 0.1466 | 0.1523 | 0.1542 | 0.1599 | 0.1618 |
| Fibonacci | 0.1453 | 0.1482 | 0.1500 | 0.1529 | 0.1558 | 0.1576 | 0.1605 |
| Pivot points | S3 | S2 | S1 | PP | R1 | R2 | R3 |
|---|---|---|---|---|---|---|---|
| Standard | 0.1373 | 0.1437 | 0.1471 | 0.1535 | 0.1569 | 0.1633 | 0.1667 |
| Camarilla | 0.1477 | 0.1486 | 0.1495 | 0.1504 | 0.1513 | 0.1522 | 0.1531 |
| Woodie | 0.1357 | 0.1430 | 0.1455 | 0.1528 | 0.1553 | 0.1626 | 0.1651 |
| Fibonacci | 0.1437 | 0.1475 | 0.1498 | 0.1535 | 0.1573 | 0.1596 | 0.1633 |
| Pivot points | S3 | S2 | S1 | PP | R1 | R2 | R3 |
|---|---|---|---|---|---|---|---|
| Standard | 0.0892 | 0.1096 | 0.1318 | 0.1522 | 0.1744 | 0.1948 | 0.2170 |
| Camarilla | 0.1423 | 0.1462 | 0.1501 | 0.1540 | 0.1579 | 0.1618 | 0.1657 |
| Woodie | 0.0901 | 0.1101 | 0.1327 | 0.1527 | 0.1753 | 0.1953 | 0.2179 |
| Fibonacci | 0.1096 | 0.1259 | 0.1359 | 0.1522 | 0.1685 | 0.1785 | 0.1948 |
Numerical data
The following is the status of the technical indicators and moving averages at the time of publication of this technical analysis:
| RSI (14): | 42.52 | |
| MACD (12,26,9): | -0.0039 | |
| Directional Movement: | -1.3055 | |
| AROON (14): | -14.2857 | |
| DEMA (21): | 0.1519 | |
| Parabolic SAR (0,02-0,02-0,2): | 0.1958 | |
| Elder Ray (13): | -0.0012 | |
| Super Trend (3,10): | 0.1453 | |
| Zig ZAG (10): | 0.1504 | |
| VORTEX (21): | 0.8993 | |
| Stochastique (14,3,5): | 11.31 | |
| TEMA (21): | 0.1528 | |
| Williams %R (14): | -95.72 | |
| Chande Momentum Oscillator (20): | -0.0114 | |
| Repulse (5,40,3): | -9.2815 | |
| ROCnROLL: | 2 | |
| TRIX (15,9): | -0.3300 | |
| Courbe Coppock: | 1.02 |
| MA7: | 0.1535 | |
| MA20: | 0.1558 | |
| MA50: | 0.1651 | |
| MA100: | 0.1864 | |
| MAexp7: | 0.1537 | |
| MAexp20: | 0.1572 | |
| MAexp50: | 0.1667 | |
| MAexp100: | 0.1831 | |
| Price / MA7: | +0.33% | |
| Price / MA20: | -1.16% | |
| Price / MA50: | -6.72% | |
| Price / MA100: | -17.38% | |
| Price / MAexp7: | +0.20% | |
| Price / MAexp20: | -2.04% | |
| Price / MAexp50: | -7.62% | |
| Price / MAexp100: | -15.89% |
News
Don't forget to follow the news on VANTIVA. At the time of publication of this analysis, the latest news was as follows:
- Vantiva announced a new short term €85 million financing
- Vantiva - September 2023 - Information concerning the total number of voting rights and shares
- Vantiva Announces it has entered into an agreement with CommScope to acquire CommScope’s Home Networks in exchange for a 25% stake in Vantiva SA., a key milestone in its strategic roadmap
- Vantiva - August 2023 - Information concerning the total number of voting rights and shares
- Vantiva’s Commitments for Near-Term Greenhouse Gas Emissions Reductions Validated by the Science Based Targets initiative
About author
Online


Add a comment
Comments
0 comments on the analysis VANTIVA - Daily