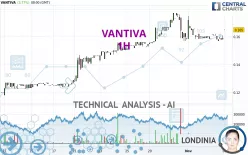
VANTIVA - 1H - Technical analysis published on 11/06/2024 (GMT)
- 105
- 0
Click here for a new analysis!
- Timeframe : 1H
- - Analysis generated on
- Status : INVALID

Summary of the analysis

Additional analysis
Quotes
VANTIVA rating 0.1650 EUR. The price registered an increase of +3.77% on the session with the lowest point at 0.1650 EUR and the highest point at 0.1650 EUR. The deviation from the price is 0% for the low point and 0% for the high point.The Central Gaps scanner detects a bullish opening marking the presence of buyers ahead of sellers at the opening but not sufficiently marked to allow the price to register a quotation gap.
Bullish opening
Type : Bullish
Timeframe : Openning
A study of price movements over other periods shows the following variations:
Technical
Technical analysis of this 1H chart of VANTIVA indicates that the overall trend is strongly bullish. The signals given by moving averages are 85.71% bullish. This strongly bullish trend seems to be running out of steam given the signals being given by short-term moving averages. An assessment of moving averages reveals several bullish signals that could impact this trend:
Bullish price crossover with Moving Average 20
Type : Bullish
Timeframe : 1 hour
Bullish price crossover with Moving Average 50
Type : Bullish
Timeframe : 1 hour
Bullish price crossover with adaptative moving average 20
Type : Bullish
Timeframe : 1 hour
Bullish price crossover with adaptative moving average 50
Type : Bullish
Timeframe : 1 hour
Bullish price crossover with adaptative moving average 100
Type : Bullish
Timeframe : 1 hour
In fact, of the 18 technical indicators analysed by Central Analyzer, 10 are bullish, 4 are neutral and 4 are bearish. Central Indicators, the detector scanner for these technical indicators recently detected a signal:
Pivot points : price is over resistance 2
Type : Neutral
Timeframe : 1 hour
The Central Patterns scanner, which studies chart patterns, resistances and supports, has identified these signals:
Near horizontal resistance
Type : Bearish
Timeframe : 1 hour
Near support of channel
Type : Bullish
Timeframe : 1 hour
From the Japanese candlestick perspective, the Central Candlesticks scanner notes the presence of these results that could impact the short-term trend:
Bearish doji star
Type : Bearish
Timeframe : 1 hour
Doji
Type : Neutral
Timeframe : 1 hour
| S3 | S2 | S1 | Price | R1 | R2 | R3 | |
|---|---|---|---|---|---|---|---|
| ProTrendLines | 0.1354 | 0.1468 | 0.1596 | 0.1650 | 0.1670 | 0.1734 | 0.8618 |
| Change (%) | -17.94% | -11.03% | -3.27% | - | +1.21% | +5.09% | +422.30% |
| Change | -0.0296 | -0.0182 | -0.0054 | - | +0.0020 | +0.0084 | +0.6968 |
| Level | Major | Minor | Intermediate | - | Minor | Major | Intermediate |
Attention could also be paid to pivot points to set price objectives:
| Pivot points | S3 | S2 | S1 | PP | R1 | R2 | R3 |
|---|---|---|---|---|---|---|---|
| Standard | 0.1517 | 0.1543 | 0.1567 | 0.1593 | 0.1617 | 0.1643 | 0.1667 |
| Camarilla | 0.1576 | 0.1581 | 0.1585 | 0.1590 | 0.1595 | 0.1599 | 0.1604 |
| Woodie | 0.1515 | 0.1543 | 0.1565 | 0.1593 | 0.1615 | 0.1643 | 0.1665 |
| Fibonacci | 0.1543 | 0.1562 | 0.1574 | 0.1593 | 0.1612 | 0.1624 | 0.1643 |
| Pivot points | S3 | S2 | S1 | PP | R1 | R2 | R3 |
|---|---|---|---|---|---|---|---|
| Standard | 0.1259 | 0.1395 | 0.1499 | 0.1635 | 0.1739 | 0.1875 | 0.1979 |
| Camarilla | 0.1538 | 0.1560 | 0.1582 | 0.1604 | 0.1626 | 0.1648 | 0.1670 |
| Woodie | 0.1244 | 0.1387 | 0.1484 | 0.1627 | 0.1724 | 0.1867 | 0.1964 |
| Fibonacci | 0.1395 | 0.1486 | 0.1543 | 0.1635 | 0.1726 | 0.1783 | 0.1875 |
| Pivot points | S3 | S2 | S1 | PP | R1 | R2 | R3 |
|---|---|---|---|---|---|---|---|
| Standard | 0.0487 | 0.0779 | 0.1185 | 0.1477 | 0.1883 | 0.2175 | 0.2581 |
| Camarilla | 0.1398 | 0.1462 | 0.1526 | 0.1590 | 0.1654 | 0.1718 | 0.1782 |
| Woodie | 0.0543 | 0.0808 | 0.1241 | 0.1506 | 0.1939 | 0.2204 | 0.2637 |
| Fibonacci | 0.0779 | 0.1046 | 0.1211 | 0.1477 | 0.1744 | 0.1909 | 0.2175 |
Numerical data
The following are the details of the technical indicators and moving averages that were collected to generate this technical analysis:
| RSI (14): | 57.77 | |
| MACD (12,26,9): | -0.0007 | |
| Directional Movement: | 11.7439 | |
| AROON (14): | 28.5714 | |
| DEMA (21): | 0.1596 | |
| Parabolic SAR (0,02-0,02-0,2): | 0.1675 | |
| Elder Ray (13): | 0.0048 | |
| Super Trend (3,10): | 0.1573 | |
| Zig ZAG (10): | 0.1650 | |
| VORTEX (21): | 0.9375 | |
| Stochastique (14,3,5): | 52.00 | |
| TEMA (21): | 0.1589 | |
| Williams %R (14): | 0.00 | |
| Chande Momentum Oscillator (20): | 0.0048 | |
| Repulse (5,40,3): | -1.1265 | |
| ROCnROLL: | 1 | |
| TRIX (15,9): | -0.1116 | |
| Courbe Coppock: | 0.39 |
| MA7: | 0.1627 | |
| MA20: | 0.1457 | |
| MA50: | 0.1243 | |
| MA100: | 0.1180 | |
| MAexp7: | 0.1604 | |
| MAexp20: | 0.1606 | |
| MAexp50: | 0.1602 | |
| MAexp100: | 0.1542 | |
| Price / MA7: | +1.41% | |
| Price / MA20: | +13.25% | |
| Price / MA50: | +32.74% | |
| Price / MA100: | +39.83% | |
| Price / MAexp7: | +2.87% | |
| Price / MAexp20: | +2.74% | |
| Price / MAexp50: | +3.00% | |
| Price / MAexp100: | +7.00% |
News
The last news published on VANTIVA at the time of the generation of this analysis was as follows:
- Tim O'Loughlin Appointed Chief Executive Officer of Vantiva and Co-opted as a Director of the Board
- Vantiva - July 2024 - Information concerning the total number of voting rights and shares
- Vantiva - First Half 2024 Results
- Vantiva - June 2024 - Information concerning the total number of voting rights and shares
- Vantiva: Repayment and maturity of the short-term loan
About author
Online


Add a comment
Comments
0 comments on the analysis VANTIVA - 1H