- Status :
- Language : English
- Registered on :
- Analyses : 93
- Overall rating : 272
- Comments : 94
- Followers : 21
- Followed : 3
Profile of the trader tasciccac
tasciccac has not yet completed the description
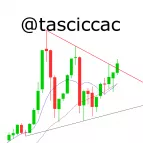
NETFLIX INC.
> Analyses

 Thank you
Reply
Chart
Thank you
Reply
Chart
tasciccac has published a new analysis.
- 21
- 93
- 272
- 94
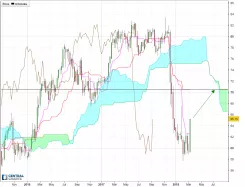
Timeframe : Weekly - Chart + Trading signal
During the last semester of 2018 the prices consolidate a multi year bullish move. Going from 423 to 231. After one year and a half evolving inside this range the prices seem to go higher…
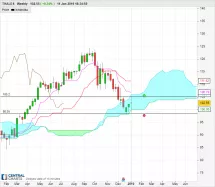
THALES
> Analyses
 Thank you
Reply
Chart
Thank you
Reply
Chart
tasciccac has published a new analysis.
- 21
- 93
- 272
- 94
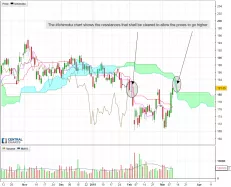
Timeframe : Weekly - Chart + One way trading
After a successful test of the bottom of the #Ichimoku cloud, we had this week a long legged doji inside the cloud showing the neutrality
Below the cloud, the actual bearish trend could continue,…
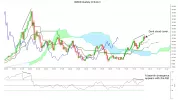
GOLDMAN SACHS GROUP INC. THE
> Analyses
 Thank you
Reply
Chart
Thank you
Reply
Chart
tasciccac has published a new analysis.
- 21
- 93
- 272
- 94
Timeframe : Weekly - Simple chart
The candles cross the #Ichimoku weekly cloud the end of May, and after a low in July, the prices stay capped by the cloud.
Last week we can see a shooting star testing the cloud, and this week a…
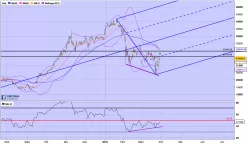
SODEXO
> Analyses
 Thank you
Reply
Chart
Thank you
Reply
Chart
tasciccac has published a new analysis.
- 21
- 93
- 272
- 94
Timeframe : Weekly - Simple chart
Since the end of the year 2017 the prices evolve inside a bearish channel, the 5th contact point with this channel will be to watch closely in the coming weeks. I will try to find a swing trading plan…
NIKKEI 225
> Analyses - Comments
 Thank you
Reply
Chart
Thank you
Reply
Chart
tasciccac posted a new comment.
- 21
- 93
- 272
- 94
En prenant un peu de recul je vois également une divergence ...
EDISON INTERNATIONAL
> Analyses
 Thank you
Reply
Chart
Thank you
Reply
Chart
tasciccac has published a new analysis.
- 21
- 93
- 272
- 94
Timeframe : Weekly - Chart + Trading signal
After a bearish acceleration below the #Ichimoku cloud, the prices have stabilized, and they could have formed an accumulation area. The closure of this week confirm the bullish breakout of Tenkan…
LOREAL
> Analyses
 Thank you
Reply
Chart
Thank you
Reply
Chart
tasciccac has published a new analysis.
- 21
- 93
- 272
- 94
Timeframe : Daily - Simple chart
After the formation of a double bottom, the prices will now be in front of two #Ichimoku resistances, the cloud (Thin) & in the same time Chikou in front of a falling Tenkan Sen + Kijun Sen.
SAINT GOBAIN
> Analyses
 Thank you
Reply
Chart
Thank you
Reply
Chart
tasciccac has published a new analysis.
- 21
- 93
- 272
- 94
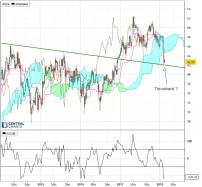
Timeframe : Weekly - Simple chart
The prices returns at the contact with an old bearish trend line passing by the top of the years 2014 & 2015. After being a resistance this line could become a support.

