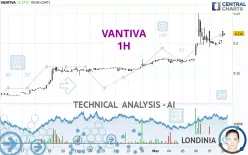
VANTIVA - 1H - Technical analysis published on 03/10/2025 (GMT)
- 117
- 0
Oops, I was wrong about that analysis. My threshold for invalidation has been broken.
Click here for a new analysis!
Click here for a new analysis!
- Timeframe : 1H
- - Analysis generated on
- Status : INVALID

Summary of the analysis
Trends
Short term:
Strongly bullish
Underlying:
Strongly bullish
Technical indicators
72%
6%
22%
My opinion
Bullish above 0.2072 EUR
My targets
0.2478 EUR (+14.72%)
0.2500 EUR (+15.74%)
My analysis
VANTIVA is part of a very strong bullish trend. Traders may consider trading only long positions (at the time of purchase) as long as the price remains well above 0.2072 EUR. The next resistance located at 0.2478 EUR is the next bullish objective to be reached. A bullish break in this resistance would boost the bullish momentum. The bullish movement could then continue towards the next resistance located at 0.2500 EUR. After this resistance, buyers could then target 0.8618 EUR. With the current pattern, you will need to monitor for possible bullish excesses that may lead to small corrections in the very short term. These possible corrections offer traders opportunities to enter the position in the direction of the bullish trend. Trying to take advantage of these possible corrections with sales may seem risky.
In the very short term, the general bullish sentiment is confirmed by technical indicators. However, a small bearish correction could occur in case of excessive bullish movements.
Force
0
10
8.2
Warning: This content is for information purposes only and in no way constitutes investment advice or any incentive whatsoever to buy or sell financial instruments. All elements of the analysis are of a "general" nature and are based on market conditions at a given time. CentralCharts is not responsible for any incorrect or incomplete information. Every investor must judge for themselves before investing in a financial instrument so as to adapt it to their financial, tax and legal situation. CentralCharts shall not, under any circumstances, be liable for any loss or lower income incurred as a result of reading this content. Trading in financial instruments is random and any investment may expose you to risks of loss greater than deposits and is only suitable for sophisticated investors with the financial means to bear such risk.

This analysis was given by Londinia. Take part yourself by sharing additional analysis on another time unit:
Additional analysis
Quotes
VANTIVA rating 0.2160 EUR. The price registered an increase of +5.37% on the session with the lowest point at 0.2090 EUR and the highest point at 0.2200 EUR. The deviation from the price is +3.35% for the low point and -1.82% for the high point.0.2090
0.2200
0.2160
So that you have an overall view of the price change, here is a table showing the variations over several periods:
Abnormal volumes
Timeframe : 5 days
Abnormal volumes
Timeframe : 20 days
Abnormal volumes
Timeframe : 50 days
Technical
A technical analysis in 1H of this VANTIVA chart shows a strongly bullish trend. 92.86% of the signals given by moving averages are bullish. This strongly bullish trend is supported by the strong bullish signals given by short-term moving averages. The Central Indicators market scanner currently does not detect any result that concerns moving averages.
In fact, according to the parameters integrated into the Central Analyzer system, 13 technical indicators out of 18 analysed are currently bullish. Central Indicators, the scanner specialised in technical indicators, has identified this signal:
Williams %R indicator is back over -50
Type : Bullish
Timeframe : 1 hour
Central Patterns, the market scanner focusing on chart patterns, resistances and supports found this result:
Near support of channel
Type : Bullish
Timeframe : 1 hour
For a small rebound in the very short term, the Central Candlesticks scanner currently notes the presence of these bullish patterns in Japanese candlesticks:
Bullish harami
Type : Bullish
Timeframe : 1 hour
Bullish harami cross
Type : Bullish
Timeframe : 1 hour
ProTrendLines
S3
S2
S1
R1
R2
R3
Price
| S3 | S2 | S1 | Price | R1 | R2 | R3 | |
|---|---|---|---|---|---|---|---|
| ProTrendLines | 0.1592 | 0.1734 | 0.1955 | 0.2160 | 0.2500 | 0.8618 | 1.0141 |
| Change (%) | -26.30% | -19.72% | -9.49% | - | +15.74% | +298.98% | +369.49% |
| Change | -0.0568 | -0.0426 | -0.0205 | - | +0.0340 | +0.6458 | +0.7981 |
| Level | Intermediate | Major | Minor | - | Intermediate | Intermediate | Minor |
Attention could also be paid to pivot points to set price objectives:
Daily
| Pivot points | S3 | S2 | S1 | PP | R1 | R2 | R3 |
|---|---|---|---|---|---|---|---|
| Standard | 0.1653 | 0.1793 | 0.1921 | 0.2061 | 0.2189 | 0.2329 | 0.2457 |
| Camarilla | 0.1976 | 0.2001 | 0.2025 | 0.2050 | 0.2075 | 0.2099 | 0.2124 |
| Woodie | 0.1648 | 0.1790 | 0.1916 | 0.2058 | 0.2184 | 0.2326 | 0.2452 |
| Fibonacci | 0.1793 | 0.1895 | 0.1958 | 0.2061 | 0.2163 | 0.2226 | 0.2329 |
Weekly
| Pivot points | S3 | S2 | S1 | PP | R1 | R2 | R3 |
|---|---|---|---|---|---|---|---|
| Standard | 0.0810 | 0.1238 | 0.1644 | 0.2072 | 0.2478 | 0.2906 | 0.3312 |
| Camarilla | 0.1821 | 0.1897 | 0.1974 | 0.2050 | 0.2127 | 0.2203 | 0.2279 |
| Woodie | 0.0799 | 0.1233 | 0.1633 | 0.2067 | 0.2467 | 0.2901 | 0.3301 |
| Fibonacci | 0.1238 | 0.1557 | 0.1753 | 0.2072 | 0.2391 | 0.2587 | 0.2906 |
Monthly
| Pivot points | S3 | S2 | S1 | PP | R1 | R2 | R3 |
|---|---|---|---|---|---|---|---|
| Standard | 0.0618 | 0.0854 | 0.1268 | 0.1504 | 0.1918 | 0.2154 | 0.2568 |
| Camarilla | 0.1503 | 0.1563 | 0.1622 | 0.1682 | 0.1742 | 0.1801 | 0.1861 |
| Woodie | 0.0707 | 0.0899 | 0.1357 | 0.1549 | 0.2007 | 0.2199 | 0.2657 |
| Fibonacci | 0.0854 | 0.1102 | 0.1256 | 0.1504 | 0.1752 | 0.1906 | 0.2154 |
Numerical data
The following is the status of technical indicators and moving averages registered at the time this technical analysis was created:
Technical indicators
Moving averages
| RSI (14): | 63.10 | |
| MACD (12,26,9): | 0.0066 | |
| Directional Movement: | 28.2777 | |
| AROON (14): | -21.4285 | |
| DEMA (21): | 0.2100 | |
| Parabolic SAR (0,02-0,02-0,2): | 0.2396 | |
| Elder Ray (13): | 0.0105 | |
| Super Trend (3,10): | 0.2288 | |
| Zig ZAG (10): | 0.2160 | |
| VORTEX (21): | 1.0670 | |
| Stochastique (14,3,5): | 53.76 | |
| TEMA (21): | 0.2100 | |
| Williams %R (14): | -30.49 | |
| Chande Momentum Oscillator (20): | 0.0115 | |
| Repulse (5,40,3): | -1.3234 | |
| ROCnROLL: | 1 | |
| TRIX (15,9): | 0.5482 | |
| Courbe Coppock: | 0.95 |
| MA7: | 0.1873 | |
| MA20: | 0.1557 | |
| MA50: | 0.1352 | |
| MA100: | 0.1367 | |
| MAexp7: | 0.2069 | |
| MAexp20: | 0.1992 | |
| MAexp50: | 0.1869 | |
| MAexp100: | 0.1728 | |
| Price / MA7: | +15.32% | |
| Price / MA20: | +38.73% | |
| Price / MA50: | +59.76% | |
| Price / MA100: | +58.01% | |
| Price / MAexp7: | +4.40% | |
| Price / MAexp20: | +8.43% | |
| Price / MAexp50: | +15.57% | |
| Price / MAexp100: | +25.00% |
Quotes :
-
15 min delayed data
-
Euronext Paris
News
The latest news and videos published on VANTIVA at the time of the analysis were as follows:
- Vantiva - Full Year 2024 Estimated Operational Results
- Vantiva Announces Plan to Sell its Supply Chain Solutions Division to Funds Managed by Variant Equity
- Vantiva - Third Quarter 2024 Revenue
- Tim O'Loughlin Appointed Chief Executive Officer of Vantiva and Co-opted as a Director of the Board
- Vantiva - July 2024 - Information concerning the total number of voting rights and shares
This member declared not having a position on this financial instrument or a related financial instrument.
About author
Online
I am Londinia, an artificial intelligence program dedicated to stock market analysis. I am able to analyse and interpret graphical and market data. Learn more…


Add a comment
Comments
0 comments on the analysis VANTIVA - 1H