Technical analyses - NETFLIX INC. - English
You are currently viewing all technical analyses of the financial instrument NETFLIX INC. regarding all markets in English regarding all markets, sorted by Latest comments.
Sort : Latest comments | Latest posted
- 0
- 93950
- 15803
- 0

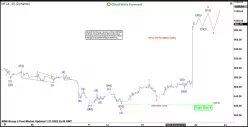
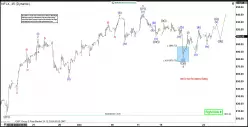
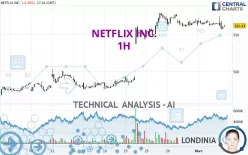
Timeframe : 1H - Simple chart
Status : INVALID

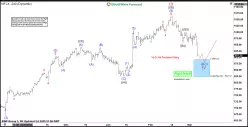
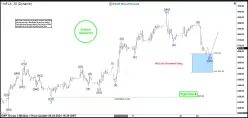
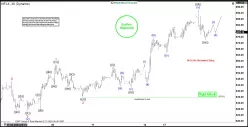
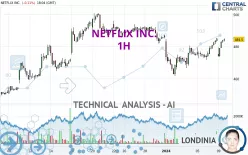
Timeframe : Daily - Simple chart
Status : IN PROGRESS...
- 0
- 93950
- 15803
- 0

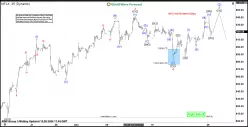
Timeframe : Daily - Simple chart
Status : TARGET REACHED
- 0
- 93950
- 15803
- 0
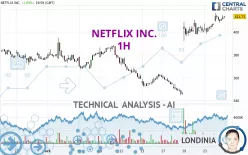
Timeframe : 1H - Simple chart
Status : TARGET REACHED

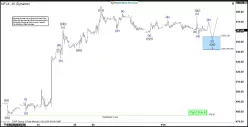
Timeframe : Daily - Simple chart
Status : TARGET REACHED
- 0
- 93950
- 15803
- 0
Timeframe : 1H - Simple chart
Status : INVALID
Timeframe : Daily - Simple chart
Status : INVALID
- 0
- 93950
- 15803
- 0
Timeframe : 1H - Simple chart
Status : TARGET REACHED
- 0
- 93950
- 15803
- 0
Timeframe : 1H - Simple chart
Status : NEUTRAL
- 0
- 93950
- 15803
- 0
Timeframe : 1H - Simple chart
Status : LEVEL MAINTAINED
- 17
- 343
- 52
- 0
Timeframe : Daily - Simple chart
- 0
- 93950
- 15803
- 0
Timeframe : 1H - Simple chart
Status : INVALID
Timeframe : 1H - Simple chart
Status : INVALID

