NETFLIX INC. - 1H - Technical analysis published on 04/02/2024 (GMT)
- 239
- 0
- Timeframe : 1H
- - Analysis generated on
- Status : NEUTRAL
Summary of the analysis

Additional analysis
Quotes
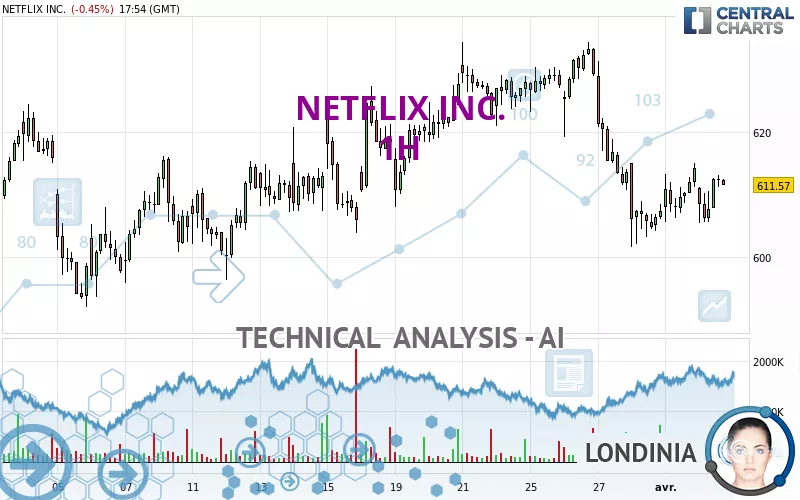
The NETFLIX INC. rating is 612.76 USD. The price is lower by -0.25% since the last closing and was between 605.51 USD and 613.06 USD. This implies that the price is at +1.20% from its lowest and at -0.05% from its highest.The Central Gaps scanner detects a bearish opening. A small advantage for sellers in the very short term.
Bearish opening
Type : Bearish
Timeframe : Openning
Here is a more detailed summary of the historical variations registered by NETFLIX INC.:
Near a new HIGH record (1 year)
Type : Bullish
Timeframe : Weekly
Near a new HIGH record (1st january)
Type : Bullish
Timeframe : Weekly
Near a new HIGH record (1 month)
Type : Bullish
Timeframe : Weekly
Technical
Technical analysis of NETFLIX INC. in 1H shows an overall slightly bearish trend. 57.14% of the signals given by moving averages are bullish. As the signals currently given by short-term moving averages are rather neutral, the overall trend could quickly return to neutral as well. The Central Indicators scanner detects a bullish signal on moving averages that could impact this trend:
Bullish trend reversal : adaptative moving average 20
Type : Bullish
Timeframe : 1 hour
In fact, according to the parameters integrated into the Central Analyzer system, 11 technical indicators out of 18 analysed are currently bullish. Central Indicators, the scanner specialised in technical indicators, has identified this signal:
Price is back under the pivot point
Type : Bearish
Timeframe : 1 hour
The Central Patterns scanner, which studies chart patterns, resistances and supports, has identified this signal:
Near resistance of channel
Type : Bearish
Timeframe : 1 hour
No result was found by the Central Candlesticks scanner on Japanese candlesticks.
| S3 | S2 | S1 | Price | R1 | R2 | R3 | |
|---|---|---|---|---|---|---|---|
| ProTrendLines | 586.34 | 592.14 | 603.96 | 612.76 | 619.34 | 624.45 | 634.38 |
| Change (%) | -4.31% | -3.37% | -1.44% | - | +1.07% | +1.91% | +3.53% |
| Change | -26.42 | -20.62 | -8.80 | - | +6.58 | +11.69 | +21.62 |
| Level | Intermediate | Intermediate | Intermediate | - | Major | Minor | Major |
Pivot points can also be used to set your price objectives. Here is the price situation in relation to pivot points:
| Pivot points | S3 | S2 | S1 | PP | R1 | R2 | R3 |
|---|---|---|---|---|---|---|---|
| Standard | 598.68 | 602.12 | 608.22 | 611.66 | 617.76 | 621.20 | 627.30 |
| Camarilla | 611.69 | 612.56 | 613.44 | 614.31 | 615.19 | 616.06 | 616.93 |
| Woodie | 600.00 | 602.79 | 609.54 | 612.33 | 619.08 | 621.87 | 628.62 |
| Fibonacci | 602.12 | 605.77 | 608.02 | 611.66 | 615.31 | 617.56 | 621.20 |
| Pivot points | S3 | S2 | S1 | PP | R1 | R2 | R3 |
|---|---|---|---|---|---|---|---|
| Standard | 561.68 | 581.64 | 594.48 | 614.44 | 627.28 | 647.24 | 660.08 |
| Camarilla | 598.31 | 601.32 | 604.32 | 607.33 | 610.34 | 613.34 | 616.35 |
| Woodie | 558.13 | 579.86 | 590.93 | 612.66 | 623.73 | 645.46 | 656.53 |
| Fibonacci | 581.64 | 594.17 | 601.91 | 614.44 | 626.97 | 634.71 | 647.24 |
| Pivot points | S3 | S2 | S1 | PP | R1 | R2 | R3 |
|---|---|---|---|---|---|---|---|
| Standard | 545.70 | 568.85 | 588.09 | 611.24 | 630.48 | 653.63 | 672.87 |
| Camarilla | 595.67 | 599.56 | 603.44 | 607.33 | 611.22 | 615.10 | 618.99 |
| Woodie | 543.75 | 567.87 | 586.14 | 610.26 | 628.53 | 652.65 | 670.92 |
| Fibonacci | 568.85 | 585.04 | 595.05 | 611.24 | 627.43 | 637.44 | 653.63 |
Numerical data
The following are the details of the technical indicators and moving averages that were collected to generate this technical analysis:
| RSI (14): | 48.79 | |
| MACD (12,26,9): | -2.1400 | |
| Directional Movement: | -2.58 | |
| AROON (14): | 57.15 | |
| DEMA (21): | 608.00 | |
| Parabolic SAR (0,02-0,02-0,2): | 605.17 | |
| Elder Ray (13): | 1.54 | |
| Super Trend (3,10): | 618.94 | |
| Zig ZAG (10): | 612.11 | |
| VORTEX (21): | 0.9400 | |
| Stochastique (14,3,5): | 63.16 | |
| TEMA (21): | 608.58 | |
| Williams %R (14): | -22.26 | |
| Chande Momentum Oscillator (20): | 5.36 | |
| Repulse (5,40,3): | 0.7600 | |
| ROCnROLL: | -1 | |
| TRIX (15,9): | -0.0800 | |
| Courbe Coppock: | 0.86 |
| MA7: | 618.98 | |
| MA20: | 613.55 | |
| MA50: | 587.44 | |
| MA100: | 529.58 | |
| MAexp7: | 610.56 | |
| MAexp20: | 611.33 | |
| MAexp50: | 615.11 | |
| MAexp100: | 614.26 | |
| Price / MA7: | -1.00% | |
| Price / MA20: | -0.13% | |
| Price / MA50: | +4.31% | |
| Price / MA100: | +15.71% | |
| Price / MAexp7: | +0.36% | |
| Price / MAexp20: | +0.23% | |
| Price / MAexp50: | -0.38% | |
| Price / MAexp100: | -0.24% |
News
The latest news and videos published on NETFLIX INC. at the time of the analysis were as follows:
- Netflix to Announce First Quarter 2024 Financial Results
- Thinking about trading options or stock in Masonite International, Shopify, SoundHound AI, Netflix, or Riot Platforms?
- Thinking about trading options or stock in Alphabet Inc, NVIDIA, Netflix, Ford Motor, or SoFi Technologies?
- Thinking about buying stock in Panbela Therapeutics, Netflix, Qualcomm, Cyngn, or Aclarion?
-
 WWE to stream exclusively on Netflix from January 2025. #Shorts #WWE #BBCNews
About author
Online


Add a comment
Comments
0 comments on the analysis NETFLIX INC. - 1H