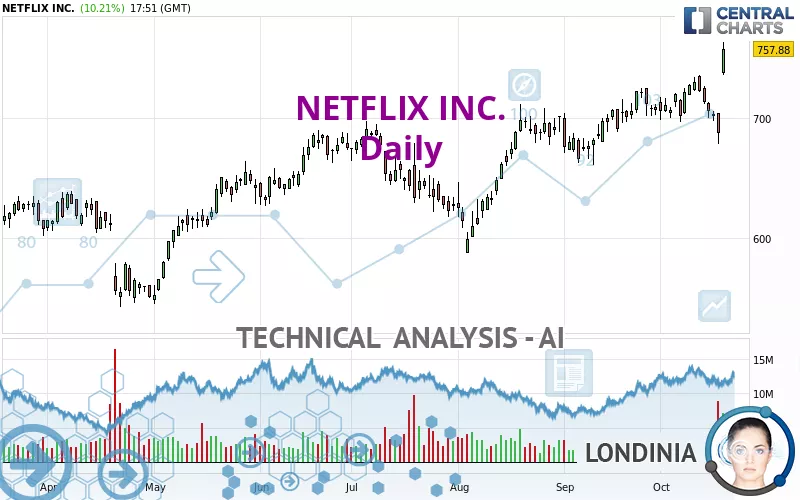
NETFLIX INC. - Daily - Technical analysis published on 10/18/2024 (GMT)
- 185
- 0
Click here for a new analysis!
- Timeframe : Daily
- - Analysis generated on
- Status : TARGET REACHED

Summary of the analysis

Additional analysis
Quotes
The NETFLIX INC. price is 757.88 USD. The price registered an increase of +10.21% on the session and was traded between 736.23 USD and 763.41 USD over the period. The price is currently at +2.94% from its lowest and -0.72% from its highest.A study of price movements over other periods shows the following variations:
New HIGH record (5 years)
Type : Bullish
Timeframe : Weekly
New HIGH record (1 year)
Type : Bullish
Timeframe : Weekly
New HIGH record (1st january)
Type : Bullish
Timeframe : Weekly
New HIGH record (1 month)
Type : Bullish
Timeframe : Weekly
Technical
A technical analysis in Daily of this NETFLIX INC. chart shows a strongly bullish trend. 92.86% of the signals given by moving averages are bullish. This strongly bullish trend is supported by the strong bullish signals given by short-term moving averages. There is no crossing of moving average by the price or crossing of moving averages between themselves.
The probability of a further increase are moderate given the direction of the technical indicators.
Central Indicators, the scanner specialised in technical indicators, has identified this signal:
Pivot points : price is over resistance 1
Type : Neutral
Timeframe : Weekly
An analysis of the price chart with the Central Patterns scanner (detector of chart patterns and resistances and supports) shows several results that can have an impact on the price change:
Horizontal resistance is broken
Type : Bullish
Timeframe : Daily
Resistance of channel is broken
Type : Bullish
Timeframe : Daily
The Central Candlesticks scanner, specialised in Japanese candlesticks, did not identify any signals.
| S3 | S2 | S1 | Price | |
|---|---|---|---|---|
| ProTrendLines | 635.84 | 691.69 | 722.26 | 757.88 |
| Change (%) | -16.10% | -8.73% | -4.70% | - |
| Change | -122.04 | -66.19 | -35.62 | - |
| Level | Intermediate | Major | Major | - |
Pivot points can also be used to set your price objectives. Here is the price situation in relation to pivot points:
| Pivot points | S3 | S2 | S1 | PP | R1 | R2 | R3 |
|---|---|---|---|---|---|---|---|
| Standard | 649.02 | 663.45 | 675.55 | 689.98 | 702.08 | 716.51 | 728.61 |
| Camarilla | 680.35 | 682.79 | 685.22 | 687.65 | 690.08 | 692.51 | 694.95 |
| Woodie | 647.86 | 662.87 | 674.39 | 689.40 | 700.92 | 715.93 | 727.45 |
| Fibonacci | 663.45 | 673.58 | 679.85 | 689.98 | 700.11 | 706.38 | 716.51 |
| Pivot points | S3 | S2 | S1 | PP | R1 | R2 | R3 |
|---|---|---|---|---|---|---|---|
| Standard | 661.24 | 678.84 | 700.81 | 718.41 | 740.38 | 757.98 | 779.95 |
| Camarilla | 711.91 | 715.54 | 719.16 | 722.79 | 726.42 | 730.05 | 733.67 |
| Woodie | 663.44 | 679.93 | 703.01 | 719.50 | 742.58 | 759.07 | 782.15 |
| Fibonacci | 678.84 | 693.95 | 703.29 | 718.41 | 733.52 | 742.86 | 757.98 |
| Pivot points | S3 | S2 | S1 | PP | R1 | R2 | R3 |
|---|---|---|---|---|---|---|---|
| Standard | 607.17 | 633.98 | 671.63 | 698.44 | 736.09 | 762.90 | 800.55 |
| Camarilla | 691.54 | 697.45 | 703.36 | 709.27 | 715.18 | 721.09 | 727.00 |
| Woodie | 612.58 | 636.69 | 677.04 | 701.15 | 741.50 | 765.61 | 805.96 |
| Fibonacci | 633.98 | 658.61 | 673.82 | 698.44 | 723.07 | 738.28 | 762.90 |
Numerical data
The following are the details of the technical indicators and moving averages that were collected to generate this technical analysis:
| RSI (14): | 64.03 | |
| MACD (12,26,9): | 7.1500 | |
| Directional Movement: | 13.39 | |
| AROON (14): | 7.14 | |
| DEMA (21): | 721.99 | |
| Parabolic SAR (0,02-0,02-0,2): | 677.88 | |
| Elder Ray (13): | 34.74 | |
| Super Trend (3,10): | 684.94 | |
| Zig ZAG (10): | 753.91 | |
| VORTEX (21): | 0.9500 | |
| Stochastique (14,3,5): | 39.94 | |
| TEMA (21): | 720.37 | |
| Williams %R (14): | -11.06 | |
| Chande Momentum Oscillator (20): | 42.89 | |
| Repulse (5,40,3): | -0.0800 | |
| ROCnROLL: | 1 | |
| TRIX (15,9): | 0.1600 | |
| Courbe Coppock: | 1.95 |
| MA7: | 716.57 | |
| MA20: | 714.38 | |
| MA50: | 694.82 | |
| MA100: | 673.32 | |
| MAexp7: | 717.94 | |
| MAexp20: | 711.67 | |
| MAexp50: | 695.25 | |
| MAexp100: | 670.36 | |
| Price / MA7: | +5.76% | |
| Price / MA20: | +6.09% | |
| Price / MA50: | +9.08% | |
| Price / MA100: | +12.56% | |
| Price / MAexp7: | +5.56% | |
| Price / MAexp20: | +6.49% | |
| Price / MAexp50: | +9.01% | |
| Price / MAexp100: | +13.06% |
News
Don't forget to follow the news on NETFLIX INC.. At the time of publication of this analysis, the latest news was as follows:
-
 Netflix Reports Earnings October 17th Will It SURPRISE? #netflix #nflx #earningsreport
- Workday and SpringHill-Produced Documentary "UNTAPPED" is Now Available on Netflix in the U.S.
-
Key earnings reports: October 14-18. #earningsreport #weekahead #tsmc #netflix #asml
-
Netflix sees mass cancellations following CEO's Harris endorsement #shorts
- Netflix to Announce Third Quarter 2024 Financial Results
About author

Online


Add a comment
Comments
0 comments on the analysis NETFLIX INC. - Daily