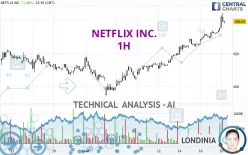
NETFLIX INC. - 1H - Technical analysis published on 08/20/2024 (GMT)
- 200
- 0
Click here for a new analysis!
- Timeframe : 1H
- - Analysis generated on
- Status : INVALID

Summary of the analysis

Additional analysis
Quotes
The NETFLIX INC. rating is 698.69 USD. The price registered an increase of +1.48% on the session with the lowest point at 688.24 USD and the highest point at 711.33 USD. The deviation from the price is +1.52% for the low point and -1.78% for the high point.The Central Gaps scanner detects the formation of a bullish gap marking the strong presence of buyers against sellers at the opening. This formed a quotation gap.
Opening Gap UP
Type : Bullish
Timeframe : Openning
So that you have an overall view of the price change, here is a table showing the variations over several periods:
New HIGH record (5 years)
Type : Bullish
Timeframe : Weekly
New HIGH record (1 year)
Type : Bullish
Timeframe : Weekly
New HIGH record (1st january)
Type : Bullish
Timeframe : Weekly
New HIGH record (1 month)
Type : Bullish
Timeframe : Weekly
Technical
A technical analysis in 1H of this NETFLIX INC. chart shows a strongly bullish trend. The signals given by the moving averages are 92.86% bullish. This strong bullish trend is confirmed by the strong signals currently being given by short-term moving averages. There is no crossing of moving average by the price or crossing of moving averages between themselves.
The probability of a further increase is high given the direction of the technical indicators.
Caution: the Central Indicators scanner currently detects an excess:
CCI indicator is overbought : over 100
Type : Neutral
Timeframe : 1 hour
Pivot points : price is over resistance 1
Type : Neutral
Timeframe : 1 hour
Pivot points : price is over resistance 1
Type : Neutral
Timeframe : Weekly
An analysis of the price chart with the Central Patterns scanner (detector of chart patterns and resistances and supports) shows several results that can have an impact on the price change:
Near horizontal resistance
Type : Bearish
Timeframe : 1 hour
Resistance of channel is broken
Type : Bullish
Timeframe : 1 hour
The presence of a bullish Japanese candlestick pattern detected by Central Candlesticks that could cause a very short term rebound was also detected:
Bullish doji star
Type : Bullish
Timeframe : 1 hour
| S3 | S2 | S1 | Price | |
|---|---|---|---|---|
| ProTrendLines | 646.86 | 679.11 | 691.69 | 698.69 |
| Change (%) | -7.42% | -2.80% | -1.00% | - |
| Change | -51.83 | -19.58 | -7.00 | - |
| Level | Intermediate | Intermediate | Major | - |
Pivot points can also be used to set your price objectives. Here is the price situation in relation to pivot points:
| Pivot points | S3 | S2 | S1 | PP | R1 | R2 | R3 |
|---|---|---|---|---|---|---|---|
| Standard | 662.08 | 667.50 | 678.01 | 683.43 | 693.94 | 699.36 | 709.87 |
| Camarilla | 684.15 | 685.61 | 687.07 | 688.53 | 689.99 | 691.45 | 692.91 |
| Woodie | 664.64 | 668.77 | 680.57 | 684.70 | 696.50 | 700.63 | 712.43 |
| Fibonacci | 667.50 | 673.58 | 677.34 | 683.43 | 689.51 | 693.27 | 699.36 |
| Pivot points | S3 | S2 | S1 | PP | R1 | R2 | R3 |
|---|---|---|---|---|---|---|---|
| Standard | 587.52 | 607.30 | 640.68 | 660.46 | 693.84 | 713.62 | 747.00 |
| Camarilla | 659.45 | 664.32 | 669.20 | 674.07 | 678.94 | 683.82 | 688.69 |
| Woodie | 594.33 | 610.70 | 647.49 | 663.86 | 700.65 | 717.02 | 753.81 |
| Fibonacci | 607.30 | 627.60 | 640.15 | 660.46 | 680.76 | 693.31 | 713.62 |
| Pivot points | S3 | S2 | S1 | PP | R1 | R2 | R3 |
|---|---|---|---|---|---|---|---|
| Standard | 517.25 | 567.12 | 597.74 | 647.61 | 678.23 | 728.10 | 758.72 |
| Camarilla | 606.22 | 613.59 | 620.97 | 628.35 | 635.73 | 643.11 | 650.49 |
| Woodie | 507.62 | 562.31 | 588.11 | 642.80 | 668.60 | 723.29 | 749.09 |
| Fibonacci | 567.12 | 597.87 | 616.87 | 647.61 | 678.36 | 697.36 | 728.10 |
Numerical data
The following is the status of technical indicators and moving averages registered at the time this technical analysis was created:
| RSI (14): | 70.31 | |
| MACD (12,26,9): | 10.4300 | |
| Directional Movement: | 40.39 | |
| AROON (14): | 64.29 | |
| DEMA (21): | 695.08 | |
| Parabolic SAR (0,02-0,02-0,2): | 688.05 | |
| Elder Ray (13): | 10.10 | |
| Super Trend (3,10): | 683.82 | |
| Zig ZAG (10): | 697.39 | |
| VORTEX (21): | 1.2700 | |
| Stochastique (14,3,5): | 75.44 | |
| TEMA (21): | 697.42 | |
| Williams %R (14): | -33.23 | |
| Chande Momentum Oscillator (20): | 21.41 | |
| Repulse (5,40,3): | 0.8100 | |
| ROCnROLL: | 1 | |
| TRIX (15,9): | 0.2000 | |
| Courbe Coppock: | 6.14 |
| MA7: | 666.73 | |
| MA20: | 638.39 | |
| MA50: | 654.82 | |
| MA100: | 633.25 | |
| MAexp7: | 692.85 | |
| MAexp20: | 681.51 | |
| MAexp50: | 664.27 | |
| MAexp100: | 652.06 | |
| Price / MA7: | +4.79% | |
| Price / MA20: | +9.45% | |
| Price / MA50: | +6.70% | |
| Price / MA100: | +10.33% | |
| Price / MAexp7: | +0.84% | |
| Price / MAexp20: | +2.52% | |
| Price / MAexp50: | +5.18% | |
| Price / MAexp100: | +7.15% |
News
The last news published on NETFLIX INC. at the time of the generation of this analysis was as follows:
-
 Chuck E. Cheese subscription plan costs less than Netflix
-
Netflix users are losing one of its cheaper options
-
Bridgerton and Baby Reindeer drive Netflix sign-ups | BBC News
-
Netflix headlines a busy week of earnings #Netflix #news #financialmarket #ev #investing #evcompany
-
'LOST' Returns to Netflix — Here’s a Look Back at Show Fun Facts
About author
Online


Add a comment
Comments
0 comments on the analysis NETFLIX INC. - 1H