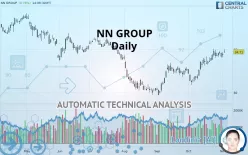
NN GROUP - Daily - Technical analysis published on 11/04/2019 (GMT)
- 280
- 0
- Who voted?
Click here for a new analysis!
- Timeframe : Daily
- - Analysis generated on
- Status : TARGET REACHED

Summary of the analysis

Additional analysis
Quotes
The NN GROUP rating is 34.71 EUR. The price registered an increase of +0.73% on the session and was traded between 34.57 EUR and 34.99 EUR over the period. The price is currently at +0.40% from its lowest and -0.80% from its highest.The Central Gaps scanner detects a bullish opening marking the presence of buyers ahead of sellers at the opening but not sufficiently marked to allow the price to register a quotation gap.
Bullish opening
Type : Bullish
Timeframe : Openning
A study of price movements over other periods shows the following variations:
Near a new HIGH record (1 month)
Type : Bullish
Timeframe : Weekly
Technical
Technical analysis of NN GROUP in Daily shows a strongly overall bullish trend. 85.71% of the signals given by moving averages are bullish. This strongly bullish trend is supported by the strong bullish signals given by short-term moving averages. An assessment of moving averages reveals a bullish signal that could impact this trend:
Bullish trend reversal : Moving Average 100
Type : Bullish
Timeframe : Daily
In fact, 12 technical indicators on 18 studied are currently bullish. Central Indicators, the detector scanner for these technical indicators has recently detected several signals:
Price is back over the pivot point
Type : Bullish
Timeframe : Daily
Price is back over the pivot point
Type : Bullish
Timeframe : Weekly
An analysis of the price chart with the Central Patterns scanner (detector of chart patterns and resistances and supports) shows several results that can have an impact on the price change:
Near resistance of channel
Type : Bearish
Timeframe : Daily
Near resistance of triangle
Type : Bearish
Timeframe : Daily
The presence of a bullish Japanese candlestick pattern detected by Central Candlesticks that could cause a very short term rebound was also detected:
Bullish harami
Type : Bullish
Timeframe : Daily
| S3 | S2 | S1 | Price | R1 | R2 | R3 | |
|---|---|---|---|---|---|---|---|
| ProTrendLines | 29.70 | 31.32 | 33.68 | 34.71 | 35.14 | 36.12 | 37.92 |
| Change (%) | -14.43% | -9.77% | -2.97% | - | +1.24% | +4.06% | +9.25% |
| Change | -5.01 | -3.39 | -1.03 | - | +0.43 | +1.41 | +3.21 |
| Level | Minor | Intermediate | Major | - | Major | Major | Minor |
To determine price objectives, it is also possible to use the pivot points. Here is the price position in relation to pivot points:
| Pivot points | S3 | S2 | S1 | PP | R1 | R2 | R3 |
|---|---|---|---|---|---|---|---|
| Standard | 33.50 | 33.78 | 34.12 | 34.40 | 34.74 | 35.02 | 35.36 |
| Camarilla | 34.29 | 34.35 | 34.40 | 34.46 | 34.52 | 34.57 | 34.63 |
| Woodie | 33.53 | 33.80 | 34.15 | 34.42 | 34.77 | 35.04 | 35.39 |
| Fibonacci | 33.78 | 34.02 | 34.16 | 34.40 | 34.64 | 34.78 | 35.02 |
| Pivot points | S3 | S2 | S1 | PP | R1 | R2 | R3 |
|---|---|---|---|---|---|---|---|
| Standard | 33.31 | 33.68 | 34.07 | 34.44 | 34.83 | 35.20 | 35.59 |
| Camarilla | 34.25 | 34.32 | 34.39 | 34.46 | 34.53 | 34.60 | 34.67 |
| Woodie | 33.32 | 33.69 | 34.08 | 34.45 | 34.84 | 35.21 | 35.60 |
| Fibonacci | 33.68 | 33.97 | 34.15 | 34.44 | 34.73 | 34.91 | 35.20 |
| Pivot points | S3 | S2 | S1 | PP | R1 | R2 | R3 |
|---|---|---|---|---|---|---|---|
| Standard | 27.45 | 29.15 | 31.66 | 33.36 | 35.87 | 37.57 | 40.08 |
| Camarilla | 33.01 | 33.40 | 33.78 | 34.17 | 34.56 | 34.94 | 35.33 |
| Woodie | 27.86 | 29.35 | 32.07 | 33.56 | 36.28 | 37.77 | 40.49 |
| Fibonacci | 29.15 | 30.76 | 31.75 | 33.36 | 34.97 | 35.96 | 37.57 |
Numerical data
The following is the status of technical indicators and moving averages registered at the time this technical analysis was created:
| RSI (14): | 64.11 | |
| MACD (12,26,9): | 0.6100 | |
| Directional Movement: | 13.15 | |
| AROON (14): | 42.86 | |
| DEMA (21): | 34.59 | |
| Parabolic SAR (0,02-0,02-0,2): | 33.99 | |
| Elder Ray (13): | 0.54 | |
| Super Trend (3,10): | 32.92 | |
| Zig ZAG (10): | 34.64 | |
| VORTEX (21): | 1.2300 | |
| Stochastique (14,3,5): | 68.85 | |
| TEMA (21): | 34.83 | |
| Williams %R (14): | -21.43 | |
| Chande Momentum Oscillator (20): | 1.31 | |
| Repulse (5,40,3): | -0.1200 | |
| ROCnROLL: | 1 | |
| TRIX (15,9): | 0.2600 | |
| Courbe Coppock: | 9.17 |
| MA7: | 34.41 | |
| MA20: | 33.73 | |
| MA50: | 32.51 | |
| MA100: | 32.79 | |
| MAexp7: | 34.40 | |
| MAexp20: | 33.80 | |
| MAexp50: | 33.06 | |
| MAexp100: | 33.07 | |
| Price / MA7: | +0.87% | |
| Price / MA20: | +2.91% | |
| Price / MA50: | +6.77% | |
| Price / MA100: | +5.86% | |
| Price / MAexp7: | +0.90% | |
| Price / MAexp20: | +2.69% | |
| Price / MAexp50: | +4.99% | |
| Price / MAexp100: | +4.96% |
News
The latest news and videos published on NN GROUP at the time of the analysis were as follows:
- NN Group published 2018 Annual Report
- Marcel Zuidam appointed CEO of Nationale-Nederlanden Bank
- Supervisory Board Chair NN Group steps down
- NN Group reports 4Q18 and 2018 results
- NN Group receives approval to expand Partial Internal Model to include Delta Lloyd entities
About author

Online


Add a comment
Comments
0 comments on the analysis NN GROUP - Daily