| Open: | 0.4276 |
| Change: | -0.0125 |
| Volume: | 44,563,446 |
| Low: | 0.4000 |
| High: | 0.4300 |
| High / Low range: | 0.0300 |
| Type: | Stocks |
| Ticker: | NN |
| ISIN: | NL0010773842 |
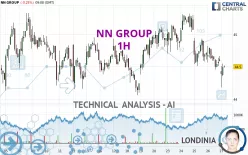
NN GROUP - 1H - Technical analysis published on 09/27/2024 (GMT)
- 105
- 0
- 09/27/2024 - 09:25
Click here for a new analysis!
- Timeframe : 1H
- - Analysis generated on 09/27/2024 - 09:25
- Status : INVALID

Summary of the analysis

Additional analysis
Quotes
NN GROUP rating 44.50 EUR. The price registered a decrease of -0.25% on the session and was traded between 44.18 EUR and 44.55 EUR over the period. The price is currently at +0.72% from its lowest and -0.11% from its highest.The Central Gaps scanner detects the formation of a bearish gap marking the strong presence of sellers ahead of buyers at the opening. This formed a quotation gap.
Opening Gap DOWN
Type : Bearish
Timeframe : Openning
A study of price movements over other periods shows the following variations:
Near a new HIGH record (5 years)
Type : Bullish
Timeframe : Weekly
Near a new HIGH record (1 year)
Type : Bullish
Timeframe : Weekly
Near a new HIGH record (1st january)
Type : Bullish
Timeframe : Weekly
Near a new HIGH record (1 month)
Type : Bullish
Timeframe : Weekly
Technical
A technical analysis in 1H of this NN GROUP chart shows a bearish trend. 75.00% of the signals given by moving averages are bearish. This bearish trend is supported by the strong bearish signals given by short-term moving averages. There is no crossing of moving average by the price or crossing of moving averages between themselves.
An assessment of technical indicators does not currently provide any relevant information on the direction of future price movements.
Caution: the Central Indicators scanner currently detects an excess:
CCI indicator is oversold : under -100
Type : Neutral
Timeframe : 1 hour
Previous candle closed under Bollinger bands
Type : Neutral
Timeframe : 1 hour
Price is back under the pivot point
Type : Bearish
Timeframe : Weekly
Central Patterns, the market scanner focusing on chart patterns, resistances and supports found this result:
Near support of channel
Type : Bullish
Timeframe : 1 hour
The Central Candlesticks scanner, specialised in Japanese candlesticks, did not identify any signals.
| S3 | S2 | S1 | Price | R1 | R2 | R3 | |
|---|---|---|---|---|---|---|---|
| ProTrendLines | 43.55 | 43.91 | 44.15 | 44.50 | 44.51 | 44.65 | 45.02 |
| Change (%) | -2.13% | -1.33% | -0.79% | - | +0.02% | +0.34% | +1.17% |
| Change | -0.95 | -0.59 | -0.35 | - | +0.01 | +0.15 | +0.52 |
| Level | Intermediate | Minor | Intermediate | - | Intermediate | Minor | Major |
Attention could also be paid to pivot points to set price objectives:
| Pivot points | S3 | S2 | S1 | PP | R1 | R2 | R3 |
|---|---|---|---|---|---|---|---|
| Standard | 44.08 | 44.27 | 44.44 | 44.63 | 44.80 | 44.99 | 45.16 |
| Camarilla | 44.51 | 44.54 | 44.58 | 44.61 | 44.64 | 44.68 | 44.71 |
| Woodie | 44.07 | 44.27 | 44.43 | 44.63 | 44.79 | 44.99 | 45.15 |
| Fibonacci | 44.27 | 44.41 | 44.49 | 44.63 | 44.77 | 44.85 | 44.99 |
| Pivot points | S3 | S2 | S1 | PP | R1 | R2 | R3 |
|---|---|---|---|---|---|---|---|
| Standard | 43.23 | 43.65 | 44.29 | 44.71 | 45.35 | 45.77 | 46.41 |
| Camarilla | 44.65 | 44.75 | 44.84 | 44.94 | 45.04 | 45.13 | 45.23 |
| Woodie | 43.35 | 43.71 | 44.41 | 44.77 | 45.47 | 45.83 | 46.53 |
| Fibonacci | 43.65 | 44.05 | 44.30 | 44.71 | 45.11 | 45.36 | 45.77 |
| Pivot points | S3 | S2 | S1 | PP | R1 | R2 | R3 |
|---|---|---|---|---|---|---|---|
| Standard | 32.64 | 35.26 | 39.78 | 42.40 | 46.92 | 49.54 | 54.06 |
| Camarilla | 42.33 | 42.98 | 43.64 | 44.29 | 44.95 | 45.60 | 46.25 |
| Woodie | 33.58 | 35.74 | 40.72 | 42.88 | 47.86 | 50.02 | 55.00 |
| Fibonacci | 35.26 | 37.99 | 39.68 | 42.40 | 45.13 | 46.82 | 49.54 |
Numerical data
The following are the details of the technical indicators and moving averages that were collected to generate this technical analysis:
| RSI (14): | 42.28 | |
| MACD (12,26,9): | -0.1100 | |
| Directional Movement: | -17.51 | |
| AROON (14): | -85.71 | |
| DEMA (21): | 44.51 | |
| Parabolic SAR (0,02-0,02-0,2): | 44.77 | |
| Elder Ray (13): | -0.09 | |
| Super Trend (3,10): | 44.88 | |
| Zig ZAG (10): | 44.52 | |
| VORTEX (21): | 0.8800 | |
| Stochastique (14,3,5): | 41.39 | |
| TEMA (21): | 44.44 | |
| Williams %R (14): | -46.87 | |
| Chande Momentum Oscillator (20): | -0.19 | |
| Repulse (5,40,3): | 0.3000 | |
| ROCnROLL: | 2 | |
| TRIX (15,9): | -0.0300 | |
| Courbe Coppock: | 1.01 |
| MA7: | 44.81 | |
| MA20: | 44.60 | |
| MA50: | 44.09 | |
| MA100: | 43.14 | |
| MAexp7: | 44.53 | |
| MAexp20: | 44.65 | |
| MAexp50: | 44.75 | |
| MAexp100: | 44.71 | |
| Price / MA7: | -0.69% | |
| Price / MA20: | -0.22% | |
| Price / MA50: | +0.93% | |
| Price / MA100: | +3.15% | |
| Price / MAexp7: | -0.07% | |
| Price / MAexp20: | -0.34% | |
| Price / MAexp50: | -0.56% | |
| Price / MAexp100: | -0.47% |
News
The latest news and videos published on NN GROUP at the time of the analysis were as follows:
- 03/14/2019 - 07:00 NN Group published 2018 Annual Report
- 02/18/2019 - 07:30 Marcel Zuidam appointed CEO of Nationale-Nederlanden Bank
- 02/14/2019 - 18:20 Supervisory Board Chair NN Group steps down
- 02/14/2019 - 06:00 NN Group reports 4Q18 and 2018 results
- 12/05/2018 - 17:24 NN Group receives approval to expand Partial Internal Model to include Delta Lloyd entities
About author
Online


Add a comment
Comments
0 comments on the analysis NN GROUP - 1H