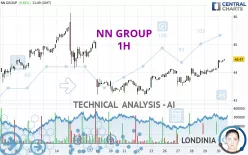
NN GROUP - 1H - Technical analysis published on 08/30/2024 (GMT)
- 137
- 0
Click here for a new analysis!
- Timeframe : 1H
- - Analysis generated on
- Status : LEVEL MAINTAINED
Summary of the analysis

Additional analysis
Quotes
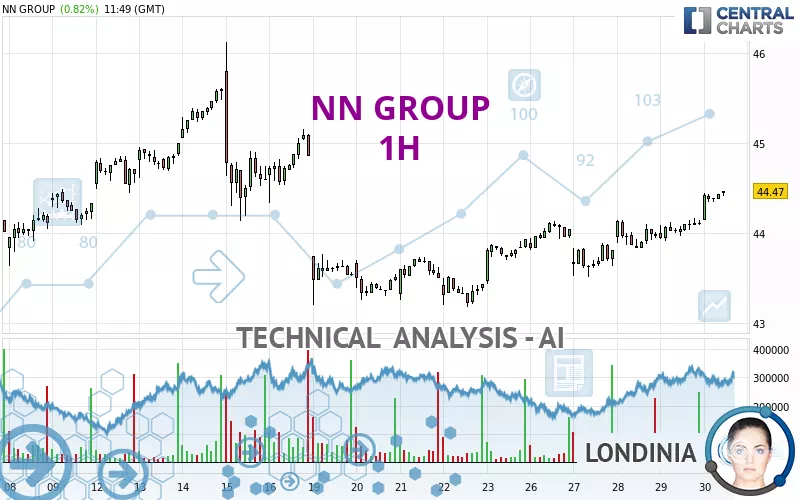
The NN GROUP price is 44.47 EUR. On the day, this instrument gained +0.82% with the lowest point at 44.15 EUR and the highest point at 44.47 EUR. The deviation from the price is +0.72% for the low point and 0% for the high point.A bullish opening was detected by the Central Gaps scanner. Buyers are trying to impose a bullish momentum in the very short term.
Bullish opening
Type : Bullish
Timeframe : Openning
A study of price movements over other periods shows the following variations:
Near a new HIGH record (5 years)
Type : Bullish
Timeframe : Weekly
Near a new HIGH record (1 year)
Type : Bullish
Timeframe : Weekly
Near a new HIGH record (1st january)
Type : Bullish
Timeframe : Weekly
Near a new HIGH record (1 month)
Type : Bullish
Timeframe : Weekly
Technical
Technical analysis of this 1H chart of NN GROUP indicates that the overall trend is strongly bullish. The signals given by the moving averages are 92.86% bullish. This strong bullish trend is confirmed by the strong signals currently being given by short-term moving averages. There is no crossing of moving average by the price or crossing of moving averages between themselves.
The probability of a further increase is high given the direction of the technical indicators.
But beware of excesses. The Central Indicators scanner currently detects this:
CCI indicator is overbought : over 100
Type : Neutral
Timeframe : 1 hour
Williams %R indicator is overbought : over -20
Type : Neutral
Timeframe : 1 hour
Pivot points : price is over resistance 2
Type : Neutral
Timeframe : 1 hour
Pivot points : price is over resistance 2
Type : Neutral
Timeframe : Weekly
Central Patterns, the scanner specializing in chart patterns, did not identify any signals.
No result was found by the Central Candlesticks scanner on Japanese candlesticks.
| S3 | S2 | S1 | Price | R1 | |
|---|---|---|---|---|---|
| ProTrendLines | 42.45 | 43.21 | 44.34 | 44.47 | 45.43 |
| Change (%) | -4.54% | -2.83% | -0.29% | - | +2.16% |
| Change | -2.02 | -1.26 | -0.13 | - | +0.96 |
| Level | Major | Major | Major | - | Minor |
To determine price objectives, it is also possible to use the pivot points. Here is the price position in relation to pivot points:
| Pivot points | S3 | S2 | S1 | PP | R1 | R2 | R3 |
|---|---|---|---|---|---|---|---|
| Standard | 43.70 | 43.80 | 43.96 | 44.06 | 44.22 | 44.32 | 44.48 |
| Camarilla | 44.04 | 44.06 | 44.09 | 44.11 | 44.13 | 44.16 | 44.18 |
| Woodie | 43.72 | 43.82 | 43.98 | 44.08 | 44.24 | 44.34 | 44.50 |
| Fibonacci | 43.80 | 43.90 | 43.96 | 44.06 | 44.16 | 44.22 | 44.32 |
| Pivot points | S3 | S2 | S1 | PP | R1 | R2 | R3 |
|---|---|---|---|---|---|---|---|
| Standard | 42.68 | 42.93 | 43.43 | 43.68 | 44.18 | 44.43 | 44.93 |
| Camarilla | 43.72 | 43.79 | 43.86 | 43.93 | 44.00 | 44.07 | 44.14 |
| Woodie | 42.81 | 42.99 | 43.56 | 43.74 | 44.31 | 44.49 | 45.06 |
| Fibonacci | 42.93 | 43.22 | 43.39 | 43.68 | 43.97 | 44.14 | 44.43 |
| Pivot points | S3 | S2 | S1 | PP | R1 | R2 | R3 |
|---|---|---|---|---|---|---|---|
| Standard | 40.14 | 41.28 | 43.15 | 44.29 | 46.16 | 47.30 | 49.17 |
| Camarilla | 44.19 | 44.47 | 44.74 | 45.02 | 45.30 | 45.57 | 45.85 |
| Woodie | 40.51 | 41.46 | 43.52 | 44.47 | 46.53 | 47.48 | 49.54 |
| Fibonacci | 41.28 | 42.43 | 43.14 | 44.29 | 45.44 | 46.15 | 47.30 |
Numerical data
The following is the status of the technical indicators and moving averages at the time of publication of this technical analysis:
| RSI (14): | 69.36 | |
| MACD (12,26,9): | 0.1400 | |
| Directional Movement: | 26.18 | |
| AROON (14): | 85.71 | |
| DEMA (21): | 44.33 | |
| Parabolic SAR (0,02-0,02-0,2): | 43.88 | |
| Elder Ray (13): | 0.20 | |
| Super Trend (3,10): | 44.11 | |
| Zig ZAG (10): | 44.44 | |
| VORTEX (21): | 1.1800 | |
| Stochastique (14,3,5): | 95.62 | |
| TEMA (21): | 44.41 | |
| Williams %R (14): | -1.82 | |
| Chande Momentum Oscillator (20): | 0.38 | |
| Repulse (5,40,3): | 0.3300 | |
| ROCnROLL: | 1 | |
| TRIX (15,9): | 0.0300 | |
| Courbe Coppock: | 1.64 |
| MA7: | 43.96 | |
| MA20: | 43.41 | |
| MA50: | 43.55 | |
| MA100: | 42.30 | |
| MAexp7: | 44.34 | |
| MAexp20: | 44.16 | |
| MAexp50: | 43.97 | |
| MAexp100: | 43.82 | |
| Price / MA7: | +1.16% | |
| Price / MA20: | +2.44% | |
| Price / MA50: | +2.11% | |
| Price / MA100: | +5.13% | |
| Price / MAexp7: | +0.29% | |
| Price / MAexp20: | +0.70% | |
| Price / MAexp50: | +1.14% | |
| Price / MAexp100: | +1.48% |
News
Don't forget to follow the news on NN GROUP. At the time of publication of this analysis, the latest news was as follows:
- NN Group published 2018 Annual Report
- Marcel Zuidam appointed CEO of Nationale-Nederlanden Bank
- Supervisory Board Chair NN Group steps down
- NN Group reports 4Q18 and 2018 results
- NN Group receives approval to expand Partial Internal Model to include Delta Lloyd entities
About author
Online


Add a comment
Comments
0 comments on the analysis NN GROUP - 1H