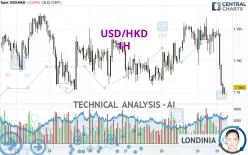
USD/HKD - 1H - Technical analysis published on 11/29/2024 (GMT)
- 111
- 0
Click here for a new analysis!
- Timeframe : 1H
- - Analysis generated on
- Status : INVALID

Summary of the analysis

Additional analysis
Quotes
The USD/HKD rating is 7.7803 HKD. On the day, this instrument lost -0.04% and was between 7.7798 HKD and 7.7847 HKD. This implies that the price is at +0.01% from its lowest and at -0.06% from its highest.A study of price movements over other periods shows the following variations:
Near a new HIGH record (5 years)
Type : Bullish
Timeframe : Weekly
Near a new HIGH record (1 year)
Type : Bullish
Timeframe : Weekly
Near a new HIGH record (1st january)
Type : Bullish
Timeframe : Weekly
Near a new HIGH record (1 month)
Type : Bullish
Timeframe : Weekly
Technical
A technical analysis in 1H of this USD/HKD chart shows a bearish trend. The signals given by moving averages are 67.86% bearish. This bearish trend is reinforced by the strong signals currently being given by short-term moving averages. The Central Indicators scanner does not detect any result on moving averages that would impact this trend.
In fact, 14 technical indicators on 18 studied are currently bearish. Other results related to technical indicators were also found by the Central Indicators scanner:
Pivot points : price is under support 1
Type : Neutral
Timeframe : 1 hour
Pivot points : price is under support 1
Type : Neutral
Timeframe : Weekly
Central Patterns, the market scanner focusing on chart patterns, resistances and supports found these results:
Near horizontal support
Type : Bullish
Timeframe : 1 hour
Support of channel is broken
Type : Bearish
Timeframe : 1 hour
The Central Candlesticks scanner, specialised in Japanese candlesticks, did not identify any signals.
| S3 | S2 | S1 | Price | R1 | R2 | R3 | |
|---|---|---|---|---|---|---|---|
| ProTrendLines | 7.7588 | 7.7674 | 7.7743 | 7.7803 | 7.7804 | 7.7811 | 7.7817 |
| Change (%) | -0.28% | -0.17% | -0.08% | - | +0.00% | +0.01% | +0.02% |
| Change | -0.0215 | -0.0129 | -0.0060 | - | +0.0001 | +0.0008 | +0.0014 |
| Level | Intermediate | Intermediate | Minor | - | Major | Intermediate | Minor |
To determine price objectives, it is also possible to use the pivot points. Here is the price position in relation to pivot points:
| Pivot points | S3 | S2 | S1 | PP | R1 | R2 | R3 |
|---|---|---|---|---|---|---|---|
| Standard | 7.7776 | 7.7791 | 7.7813 | 7.7828 | 7.7850 | 7.7865 | 7.7887 |
| Camarilla | 7.7824 | 7.7827 | 7.7831 | 7.7834 | 7.7837 | 7.7841 | 7.7844 |
| Woodie | 7.7779 | 7.7793 | 7.7816 | 7.7830 | 7.7853 | 7.7867 | 7.7890 |
| Fibonacci | 7.7791 | 7.7806 | 7.7814 | 7.7828 | 7.7843 | 7.7851 | 7.7865 |
| Pivot points | S3 | S2 | S1 | PP | R1 | R2 | R3 |
|---|---|---|---|---|---|---|---|
| Standard | 7.7742 | 7.7773 | 7.7807 | 7.7838 | 7.7872 | 7.7903 | 7.7937 |
| Camarilla | 7.7823 | 7.7829 | 7.7835 | 7.7841 | 7.7847 | 7.7853 | 7.7859 |
| Woodie | 7.7744 | 7.7774 | 7.7809 | 7.7839 | 7.7874 | 7.7904 | 7.7939 |
| Fibonacci | 7.7773 | 7.7798 | 7.7813 | 7.7838 | 7.7863 | 7.7878 | 7.7903 |
| Pivot points | S3 | S2 | S1 | PP | R1 | R2 | R3 |
|---|---|---|---|---|---|---|---|
| Standard | 7.7482 | 7.7546 | 7.7643 | 7.7707 | 7.7804 | 7.7868 | 7.7965 |
| Camarilla | 7.7696 | 7.7711 | 7.7725 | 7.7740 | 7.7755 | 7.7770 | 7.7784 |
| Woodie | 7.7499 | 7.7554 | 7.7660 | 7.7715 | 7.7821 | 7.7876 | 7.7982 |
| Fibonacci | 7.7546 | 7.7608 | 7.7646 | 7.7707 | 7.7769 | 7.7807 | 7.7868 |
Numerical data
The following is the status of the technical indicators and moving averages at the time of publication of this technical analysis:
| RSI (14): | 30.86 | |
| MACD (12,26,9): | -0.0005 | |
| Directional Movement: | -23.8363 | |
| AROON (14): | -78.5714 | |
| DEMA (21): | 7.7820 | |
| Parabolic SAR (0,02-0,02-0,2): | 7.7842 | |
| Elder Ray (13): | -0.0021 | |
| Super Trend (3,10): | 7.7830 | |
| Zig ZAG (10): | 7.7803 | |
| VORTEX (21): | 0.8393 | |
| Stochastique (14,3,5): | 4.08 | |
| TEMA (21): | 7.7813 | |
| Williams %R (14): | -89.80 | |
| Chande Momentum Oscillator (20): | -0.0030 | |
| Repulse (5,40,3): | -0.0183 | |
| ROCnROLL: | 2 | |
| TRIX (15,9): | -0.0001 | |
| Courbe Coppock: | 0.05 |
| MA7: | 7.7825 | |
| MA20: | 7.7798 | |
| MA50: | 7.7752 | |
| MA100: | 7.7873 | |
| MAexp7: | 7.7814 | |
| MAexp20: | 7.7825 | |
| MAexp50: | 7.7826 | |
| MAexp100: | 7.7826 | |
| Price / MA7: | -0.03% | |
| Price / MA20: | +0.01% | |
| Price / MA50: | +0.07% | |
| Price / MA100: | -0.09% | |
| Price / MAexp7: | -0.01% | |
| Price / MAexp20: | -0.03% | |
| Price / MAexp50: | -0.03% | |
| Price / MAexp100: | -0.03% |
News
The latest news and videos published on USD/HKD at the time of the analysis were as follows:
About author
Online


Add a comment
Comments
0 comments on the analysis USD/HKD - 1H