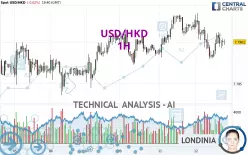
USD/HKD - 1H - Technical analysis published on 02/12/2025 (GMT)
- 145
- 0
- Timeframe : 1H
- - Analysis generated on
- Status : NEUTRAL

Summary of the analysis

Additional analysis
Quotes
USD/HKD rating 7.7900 HKD. The price is lower by -0.02% since the last closing with the lowest point at 7.7880 HKD and the highest point at 7.7936 HKD. The deviation from the price is +0.03% for the low point and -0.05% for the high point.So that you have an overall view of the price change, here is a table showing the variations over several periods:
Near a new HIGH record (5 years)
Type : Bullish
Timeframe : Weekly
Near a new HIGH record (1 year)
Type : Bullish
Timeframe : Weekly
Near a new HIGH record (1st january)
Type : Bullish
Timeframe : Weekly
Near a new HIGH record (1 month)
Type : Bullish
Timeframe : Weekly
Technical
Technical analysis of USD/HKD in 1H shows a neutral overall trend. This indecision could turn into a bearish trend due to the slightly bearish signals currently given by short-term moving averages. The Central Indicators scanner detects bullish and bearish signals on moving averages that could impact this trend:
Bullish trend reversal : adaptative moving average 100
Type : Bullish
Timeframe : 1 hour
Bullish price crossover with Moving Average 20
Type : Bullish
Timeframe : 1 hour
Bullish price crossover with adaptative moving average 20
Type : Bullish
Timeframe : 1 hour
Bearish price crossover with adaptative moving average 50
Type : Bearish
Timeframe : 1 hour
In fact, only 8 technical indicators out of 18 studied are currently bullish. Central Indicators, the scanner specialised in technical indicators, has identified these signals:
Price is back under the pivot point
Type : Bearish
Timeframe : Weekly
Williams %R indicator is back under -50
Type : Bearish
Timeframe : 1 hour
The Central Patterns scanner, which studies chart patterns, resistances and supports, has identified these signals:
Near horizontal support
Type : Bullish
Timeframe : 1 hour
Support of channel is broken
Type : Bearish
Timeframe : 1 hour
No result was found by the Central Candlesticks scanner on Japanese candlesticks.
| S3 | S2 | S1 | Price | R1 | R2 | R3 | |
|---|---|---|---|---|---|---|---|
| ProTrendLines | 7.7843 | 7.7873 | 7.7891 | 7.7900 | 7.7909 | 7.7934 | 7.7945 |
| Change (%) | -0.07% | -0.03% | -0.01% | - | +0.01% | +0.04% | +0.06% |
| Change | -0.0057 | -0.0027 | -0.0009 | - | +0.0009 | +0.0034 | +0.0045 |
| Level | Major | Minor | Major | - | Major | Intermediate | Minor |
To determine price objectives, it is also possible to use the pivot points. Here is the price position in relation to pivot points:
| Pivot points | S3 | S2 | S1 | PP | R1 | R2 | R3 |
|---|---|---|---|---|---|---|---|
| Standard | 7.7837 | 7.7860 | 7.7889 | 7.7912 | 7.7941 | 7.7964 | 7.7993 |
| Camarilla | 7.7905 | 7.7910 | 7.7914 | 7.7919 | 7.7924 | 7.7929 | 7.7933 |
| Woodie | 7.7841 | 7.7862 | 7.7893 | 7.7914 | 7.7945 | 7.7966 | 7.7997 |
| Fibonacci | 7.7860 | 7.7880 | 7.7892 | 7.7912 | 7.7932 | 7.7944 | 7.7964 |
| Pivot points | S3 | S2 | S1 | PP | R1 | R2 | R3 |
|---|---|---|---|---|---|---|---|
| Standard | 7.7723 | 7.7779 | 7.7842 | 7.7898 | 7.7961 | 7.8017 | 7.8080 |
| Camarilla | 7.7871 | 7.7882 | 7.7893 | 7.7904 | 7.7915 | 7.7926 | 7.7937 |
| Woodie | 7.7726 | 7.7781 | 7.7845 | 7.7900 | 7.7964 | 7.8019 | 7.8083 |
| Fibonacci | 7.7779 | 7.7825 | 7.7853 | 7.7898 | 7.7944 | 7.7972 | 7.8017 |
| Pivot points | S3 | S2 | S1 | PP | R1 | R2 | R3 |
|---|---|---|---|---|---|---|---|
| Standard | 7.7475 | 7.7571 | 7.7746 | 7.7842 | 7.8017 | 7.8113 | 7.8288 |
| Camarilla | 7.7848 | 7.7872 | 7.7897 | 7.7922 | 7.7947 | 7.7972 | 7.7997 |
| Woodie | 7.7516 | 7.7591 | 7.7787 | 7.7862 | 7.8058 | 7.8133 | 7.8329 |
| Fibonacci | 7.7571 | 7.7674 | 7.7738 | 7.7842 | 7.7945 | 7.8009 | 7.8113 |
Numerical data
The following is the status of technical indicators and moving averages registered at the time this technical analysis was created:
| RSI (14): | 49.15 | |
| MACD (12,26,9): | -0.0003 | |
| Directional Movement: | 2.4378 | |
| AROON (14): | -21.4285 | |
| DEMA (21): | 7.7899 | |
| Parabolic SAR (0,02-0,02-0,2): | 7.7886 | |
| Elder Ray (13): | 0.0001 | |
| Super Trend (3,10): | 7.7919 | |
| Zig ZAG (10): | 7.7903 | |
| VORTEX (21): | 0.9403 | |
| Stochastique (14,3,5): | 52.14 | |
| TEMA (21): | 7.7896 | |
| Williams %R (14): | -48.72 | |
| Chande Momentum Oscillator (20): | -0.0003 | |
| Repulse (5,40,3): | -0.0016 | |
| ROCnROLL: | 2 | |
| TRIX (15,9): | -0.0008 | |
| Courbe Coppock: | 0.03 |
| MA7: | 7.7888 | |
| MA20: | 7.7886 | |
| MA50: | 7.7810 | |
| MA100: | 7.7780 | |
| MAexp7: | 7.7900 | |
| MAexp20: | 7.7903 | |
| MAexp50: | 7.7904 | |
| MAexp100: | 7.7901 | |
| Price / MA7: | +0.02% | |
| Price / MA20: | +0.02% | |
| Price / MA50: | +0.12% | |
| Price / MA100: | +0.15% | |
| Price / MAexp7: | -0% | |
| Price / MAexp20: | +0.00% | |
| Price / MAexp50: | -0.01% | |
| Price / MAexp100: | +0.00% |
News
The latest news and videos published on USD/HKD at the time of the analysis were as follows:
About author
Online


Add a comment
Comments
0 comments on the analysis USD/HKD - 1H