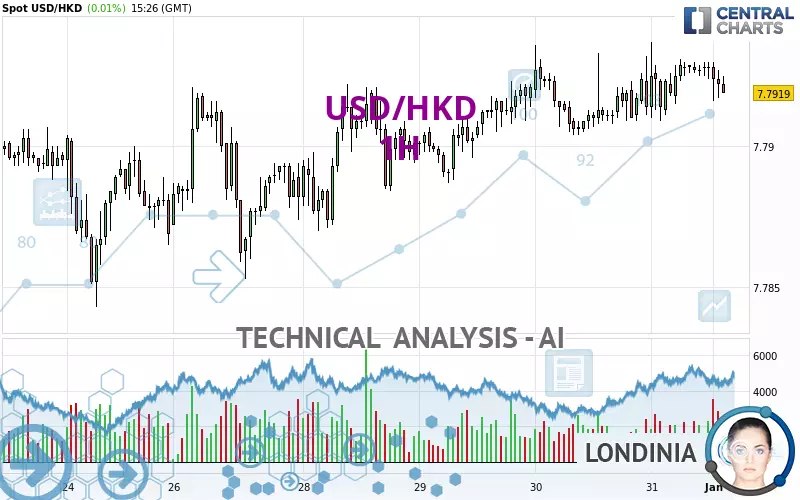
USD/HKD - 1H - Technical analysis published on 01/31/2025 (GMT)
- 128
- 0
Click here for a new analysis!
- Timeframe : 1H
- - Analysis generated on
- Status : TARGET REACHED

Summary of the analysis

Additional analysis
Quotes
The USD/HKD rating is 7.7919 HKD. On the day, this instrument gained +0.01% and was between 7.7909 HKD and 7.7937 HKD. This implies that the price is at +0.01% from its lowest and at -0.02% from its highest.A study of price movements over other periods shows the following variations:
Near a new HIGH record (5 years)
Type : Bullish
Timeframe : Weekly
Near a new HIGH record (1 year)
Type : Bullish
Timeframe : Weekly
New HIGH record (1st january)
Type : Bullish
Timeframe : Weekly
New HIGH record (1 month)
Type : Bullish
Timeframe : Weekly
Technical
Technical analysis of this 1H chart of USD/HKD indicates that the overall trend is bullish. The signals given by moving averages are 75.00% bullish. This bullish trend could slow down given the neutral signals currently being given by short-term moving averages. The Central Indicators scanner detects bullish and bearish signals on moving averages that could impact this trend:
Bearish trend reversal : adaptative moving average 20
Type : Bearish
Timeframe : 1 hour
Bullish price crossover with Moving Average 20
Type : Bullish
Timeframe : 1 hour
In fact, Central Analyzer took into account 18 technical indicators and the result was as follows: 5 are bullish, 9 are neutral and 4 are bearish. No additional result has been identified by Central Indicators, the scanner specialised in technical indicators.
An analysis of the price chart with the Central Patterns scanner (detector of chart patterns and resistances and supports) shows a result that can have an impact on the price change:
Near resistance of channel
Type : Bearish
Timeframe : 1 hour
The Central Candlesticks scanner currently notes the presence of this pattern in Japanese candlesticks that could mark the end of the short-term trend currently underway:
Doji
Type : Neutral
Timeframe : 1 hour
| S3 | S2 | S1 | Price | R1 | R2 | R3 | |
|---|---|---|---|---|---|---|---|
| ProTrendLines | 7.7865 | 7.7891 | 7.7904 | 7.7919 | 7.7922 | 7.7941 | 7.8019 |
| Change (%) | -0.07% | -0.04% | -0.02% | - | +0.00% | +0.03% | +0.13% |
| Change | -0.0054 | -0.0028 | -0.0015 | - | +0.0003 | +0.0022 | +0.0100 |
| Level | Minor | Major | Intermediate | - | Intermediate | Minor | Major |
To determine price objectives, it is also possible to use the pivot points. Here is the price position in relation to pivot points:
| Pivot points | S3 | S2 | S1 | PP | R1 | R2 | R3 |
|---|---|---|---|---|---|---|---|
| Standard | 7.7868 | 7.7886 | 7.7900 | 7.7918 | 7.7932 | 7.7950 | 7.7964 |
| Camarilla | 7.7905 | 7.7908 | 7.7911 | 7.7914 | 7.7917 | 7.7920 | 7.7923 |
| Woodie | 7.7866 | 7.7885 | 7.7898 | 7.7917 | 7.7930 | 7.7949 | 7.7962 |
| Fibonacci | 7.7886 | 7.7898 | 7.7906 | 7.7918 | 7.7930 | 7.7938 | 7.7950 |
| Pivot points | S3 | S2 | S1 | PP | R1 | R2 | R3 |
|---|---|---|---|---|---|---|---|
| Standard | 7.7663 | 7.7723 | 7.7796 | 7.7856 | 7.7929 | 7.7989 | 7.8062 |
| Camarilla | 7.7832 | 7.7845 | 7.7857 | 7.7869 | 7.7881 | 7.7893 | 7.7906 |
| Woodie | 7.7670 | 7.7726 | 7.7803 | 7.7859 | 7.7936 | 7.7992 | 7.8069 |
| Fibonacci | 7.7723 | 7.7774 | 7.7805 | 7.7856 | 7.7907 | 7.7938 | 7.7989 |
| Pivot points | S3 | S2 | S1 | PP | R1 | R2 | R3 |
|---|---|---|---|---|---|---|---|
| Standard | 7.7304 | 7.7447 | 7.7565 | 7.7708 | 7.7826 | 7.7969 | 7.8087 |
| Camarilla | 7.7611 | 7.7635 | 7.7659 | 7.7683 | 7.7707 | 7.7731 | 7.7755 |
| Woodie | 7.7292 | 7.7441 | 7.7553 | 7.7702 | 7.7814 | 7.7963 | 7.8075 |
| Fibonacci | 7.7447 | 7.7547 | 7.7608 | 7.7708 | 7.7808 | 7.7869 | 7.7969 |
Numerical data
The following are the details of the technical indicators and moving averages that were collected to generate this technical analysis:
| RSI (14): | 50.73 | |
| MACD (12,26,9): | 0.0003 | |
| Directional Movement: | 3.1343 | |
| AROON (14): | 28.5714 | |
| DEMA (21): | 7.7927 | |
| Parabolic SAR (0,02-0,02-0,2): | 7.7931 | |
| Elder Ray (13): | -0.0002 | |
| Super Trend (3,10): | 7.7901 | |
| Zig ZAG (10): | 7.7923 | |
| VORTEX (21): | 1.0315 | |
| Stochastique (14,3,5): | 57.25 | |
| TEMA (21): | 7.7926 | |
| Williams %R (14): | -36.36 | |
| Chande Momentum Oscillator (20): | 0.0000 | |
| Repulse (5,40,3): | -0.0027 | |
| ROCnROLL: | -1 | |
| TRIX (15,9): | 0.0006 | |
| Courbe Coppock: | 0.02 |
| MA7: | 7.7901 | |
| MA20: | 7.7858 | |
| MA50: | 7.7799 | |
| MA100: | 7.7784 | |
| MAexp7: | 7.7925 | |
| MAexp20: | 7.7923 | |
| MAexp50: | 7.7917 | |
| MAexp100: | 7.7909 | |
| Price / MA7: | +0.02% | |
| Price / MA20: | +0.08% | |
| Price / MA50: | +0.15% | |
| Price / MA100: | +0.17% | |
| Price / MAexp7: | -0.01% | |
| Price / MAexp20: | -0.01% | |
| Price / MAexp50: | +0.00% | |
| Price / MAexp100: | +0.01% |
News
Don't forget to follow the news on USD/HKD. At the time of publication of this analysis, the latest news was as follows:
About author

Online


Add a comment
Comments
0 comments on the analysis USD/HKD - 1H