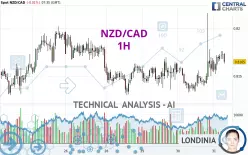
NZD/CAD - 1H - Technical analysis published on 01/31/2025 (GMT)
- 78
- 0
Click here for a new analysis!
- Timeframe : 1H
- - Analysis generated on
- Status : TARGET REACHED

Summary of the analysis

Additional analysis
Quotes
The NZD/CAD price is 0.8165 CAD. The price is lower by -0.01% since the last closing and was traded between 0.8152 CAD and 0.8176 CAD over the period. The price is currently at +0.16% from its lowest and -0.13% from its highest.The Central Gaps scanner detects a bearish opening. A small advantage for sellers in the very short term.
Bearish opening
Type : Bearish
Timeframe : Openning
Here is a more detailed summary of the historical variations registered by NZD/CAD:
Near a new LOW record (1 year)
Type : Bearish
Timeframe : Weekly
Near a new LOW record (1st january)
Type : Bearish
Timeframe : Weekly
Near a new LOW record (1 month)
Type : Bearish
Timeframe : Weekly
Technical
Technical analysis of NZD/CAD in 1H shows an overall bullish trend. 78.57% of the signals given by moving averages are bullish. The overall trend is reinforced by the strong bullish signals from short-term moving averages. The Central Indicators scanner detects a bullish signal on moving averages that could impact this trend:
Moving Average bullish crossovers : AMA20 & AMA50
Type : Bullish
Timeframe : 1 hour
In fact, 10 technical indicators on 18 studied are currently positioned bullish. But beware of excesses. The Central Indicators scanner currently detects this:
RSI indicator: bearish divergence
Type : Bearish
Timeframe : 1 hour
Price is back under the pivot point
Type : Bearish
Timeframe : 1 hour
The Central Patterns scanner, which studies chart patterns, resistances and supports, has identified these signals:
Near resistance of channel
Type : Bearish
Timeframe : 1 hour
Near resistance of triangle
Type : Bearish
Timeframe : 1 hour
The Central Candlesticks scanner which studies Japanese candlesticks did not detect anything.
| S3 | S2 | S1 | Price | R1 | R2 | R3 | |
|---|---|---|---|---|---|---|---|
| ProTrendLines | 0.8113 | 0.8137 | 0.8155 | 0.8165 | 0.8170 | 0.8188 | 0.8202 |
| Change (%) | -0.64% | -0.34% | -0.12% | - | +0.06% | +0.28% | +0.45% |
| Change | -0.0052 | -0.0028 | -0.0010 | - | +0.0005 | +0.0023 | +0.0037 |
| Level | Minor | Major | Minor | - | Major | Major | Intermediate |
Attention could also be paid to pivot points to set price objectives:
| Pivot points | S3 | S2 | S1 | PP | R1 | R2 | R3 |
|---|---|---|---|---|---|---|---|
| Standard | 0.8044 | 0.8089 | 0.8127 | 0.8172 | 0.8210 | 0.8255 | 0.8293 |
| Camarilla | 0.8143 | 0.8151 | 0.8158 | 0.8166 | 0.8174 | 0.8181 | 0.8189 |
| Woodie | 0.8042 | 0.8087 | 0.8125 | 0.8170 | 0.8208 | 0.8253 | 0.8291 |
| Fibonacci | 0.8089 | 0.8120 | 0.8140 | 0.8172 | 0.8203 | 0.8223 | 0.8255 |
| Pivot points | S3 | S2 | S1 | PP | R1 | R2 | R3 |
|---|---|---|---|---|---|---|---|
| Standard | 0.7988 | 0.8033 | 0.8111 | 0.8156 | 0.8234 | 0.8279 | 0.8357 |
| Camarilla | 0.8154 | 0.8166 | 0.8177 | 0.8188 | 0.8199 | 0.8211 | 0.8222 |
| Woodie | 0.8004 | 0.8041 | 0.8127 | 0.8164 | 0.8250 | 0.8287 | 0.8373 |
| Fibonacci | 0.8033 | 0.8080 | 0.8109 | 0.8156 | 0.8203 | 0.8232 | 0.8279 |
| Pivot points | S3 | S2 | S1 | PP | R1 | R2 | R3 |
|---|---|---|---|---|---|---|---|
| Standard | 0.7677 | 0.7859 | 0.7950 | 0.8132 | 0.8223 | 0.8405 | 0.8496 |
| Camarilla | 0.7966 | 0.7991 | 0.8016 | 0.8041 | 0.8066 | 0.8091 | 0.8116 |
| Woodie | 0.7632 | 0.7836 | 0.7905 | 0.8109 | 0.8178 | 0.8382 | 0.8451 |
| Fibonacci | 0.7859 | 0.7963 | 0.8028 | 0.8132 | 0.8236 | 0.8301 | 0.8405 |
Numerical data
The following are the details of the technical indicators and moving averages that were collected to generate this technical analysis:
| RSI (14): | 58.33 | |
| MACD (12,26,9): | 0.0006 | |
| Directional Movement: | 17.8974 | |
| AROON (14): | 21.4286 | |
| DEMA (21): | 0.8168 | |
| Parabolic SAR (0,02-0,02-0,2): | 0.8162 | |
| Elder Ray (13): | 0.0006 | |
| Super Trend (3,10): | 0.8135 | |
| Zig ZAG (10): | 0.8168 | |
| VORTEX (21): | 1.1088 | |
| Stochastique (14,3,5): | 40.79 | |
| TEMA (21): | 0.8173 | |
| Williams %R (14): | -64.47 | |
| Chande Momentum Oscillator (20): | 0.0016 | |
| Repulse (5,40,3): | -0.0496 | |
| ROCnROLL: | 1 | |
| TRIX (15,9): | 0.0075 | |
| Courbe Coppock: | 0.52 |
| MA7: | 0.8164 | |
| MA20: | 0.8107 | |
| MA50: | 0.8154 | |
| MA100: | 0.8259 | |
| MAexp7: | 0.8168 | |
| MAexp20: | 0.8161 | |
| MAexp50: | 0.8156 | |
| MAexp100: | 0.8155 | |
| Price / MA7: | +0.01% | |
| Price / MA20: | +0.72% | |
| Price / MA50: | +0.13% | |
| Price / MA100: | -1.14% | |
| Price / MAexp7: | -0.04% | |
| Price / MAexp20: | +0.05% | |
| Price / MAexp50: | +0.11% | |
| Price / MAexp100: | +0.12% |
News
Don't forget to follow the news on NZD/CAD. At the time of publication of this analysis, the latest news was as follows:
-
 NZD/CAD Forecast September 6, 2024
-
Trading into 2024: Rules of Alternation in Elliot Wave using NZD/CAD
-
New Zealand Dollar Soars on RBNZ: NZD/USD, NZD/JPY, NZD/CAD Analysis
-
Quick Takes Video: Volatility vs Inevitability for USD/CAD, NZD/JPY, NZD/CAD
-
NZD/CAD To Potentially Reach Parity
About author
Online


Add a comment
Comments
0 comments on the analysis NZD/CAD - 1H