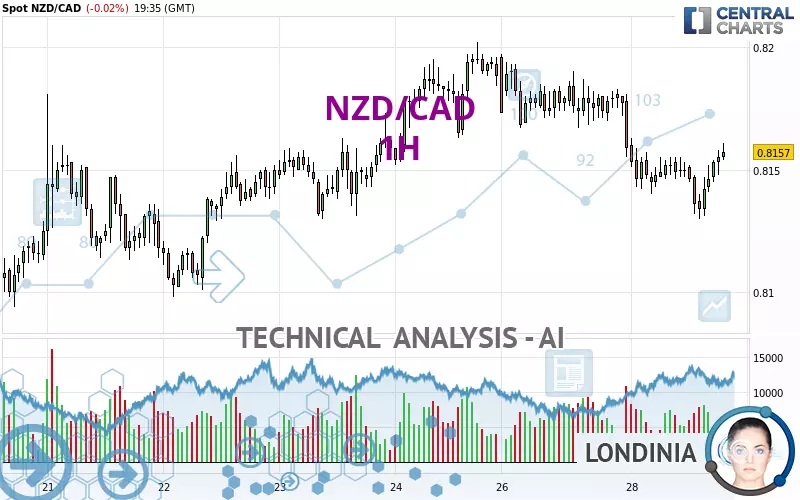
NZD/CAD - 1H - Technical analysis published on 01/28/2025 (GMT)
- 186
- 0
- Timeframe : 1H
- - Analysis generated on
- Status : NEUTRAL

Summary of the analysis

Additional analysis
Quotes
The NZD/CAD rating is 0.8157 CAD. The price is lower by -0.03% since the last closing and was between 0.8130 CAD and 0.8163 CAD. This implies that the price is at +0.33% from its lowest and at -0.07% from its highest.A bullish opening was detected by the Central Gaps scanner. Buyers are trying to impose a bullish momentum in the very short term.
Bullish opening
Type : Bullish
Timeframe : Openning
So that you have an overall view of the price change, here is a table showing the variations over several periods:
Near a new LOW record (1 year)
Type : Bearish
Timeframe : Weekly
Near a new LOW record (1st january)
Type : Bearish
Timeframe : Weekly
Near a new LOW record (1 month)
Type : Bearish
Timeframe : Weekly
Technical
Technical analysis of NZD/CAD in 1H shows an overall slightly bullish trend. 50.00% of the signals given by moving averages are bullish. As the signals currently given by short-term moving averages are rather neutral, the slightly bullish trend could return to neutral. The Central Indicators scanner does not detect any result on moving averages that would impact this trend.
In fact, according to the parameters integrated into the Central Analyzer system, 12 technical indicators out of 18 analysed are currently bullish. But beware of excesses. The Central Indicators scanner currently detects this:
CCI indicator is overbought : over 100
Type : Neutral
Timeframe : 1 hour
Williams %R indicator is overbought : over -20
Type : Neutral
Timeframe : 1 hour
An analysis of the price chart with the Central Patterns scanner (detector of chart patterns and resistances and supports) shows several results that can have an impact on the price change:
Near horizontal support
Type : Bullish
Timeframe : 1 hour
Support of channel is broken
Type : Bearish
Timeframe : 1 hour
The Central Candlesticks scanner, specialised in Japanese candlesticks, did not identify any signals.
| S3 | S2 | S1 | Price | R1 | R2 | R3 | |
|---|---|---|---|---|---|---|---|
| ProTrendLines | 0.8068 | 0.8098 | 0.8137 | 0.8157 | 0.8167 | 0.8212 | 0.8303 |
| Change (%) | -1.09% | -0.72% | -0.25% | - | +0.12% | +0.67% | +1.79% |
| Change | -0.0089 | -0.0059 | -0.0020 | - | +0.0010 | +0.0055 | +0.0146 |
| Level | Minor | Intermediate | Major | - | Intermediate | Intermediate | Minor |
Pivot points can also be used to set your price objectives. Here is the price situation in relation to pivot points:
| Pivot points | S3 | S2 | S1 | PP | R1 | R2 | R3 |
|---|---|---|---|---|---|---|---|
| Standard | 0.8102 | 0.8128 | 0.8144 | 0.8170 | 0.8186 | 0.8212 | 0.8228 |
| Camarilla | 0.8148 | 0.8151 | 0.8155 | 0.8159 | 0.8163 | 0.8167 | 0.8171 |
| Woodie | 0.8096 | 0.8126 | 0.8138 | 0.8168 | 0.8180 | 0.8210 | 0.8222 |
| Fibonacci | 0.8128 | 0.8144 | 0.8154 | 0.8170 | 0.8186 | 0.8196 | 0.8212 |
| Pivot points | S3 | S2 | S1 | PP | R1 | R2 | R3 |
|---|---|---|---|---|---|---|---|
| Standard | 0.7988 | 0.8033 | 0.8111 | 0.8156 | 0.8234 | 0.8279 | 0.8357 |
| Camarilla | 0.8154 | 0.8166 | 0.8177 | 0.8188 | 0.8199 | 0.8211 | 0.8222 |
| Woodie | 0.8004 | 0.8041 | 0.8127 | 0.8164 | 0.8250 | 0.8287 | 0.8373 |
| Fibonacci | 0.8033 | 0.8080 | 0.8109 | 0.8156 | 0.8203 | 0.8232 | 0.8279 |
| Pivot points | S3 | S2 | S1 | PP | R1 | R2 | R3 |
|---|---|---|---|---|---|---|---|
| Standard | 0.7677 | 0.7859 | 0.7950 | 0.8132 | 0.8223 | 0.8405 | 0.8496 |
| Camarilla | 0.7966 | 0.7991 | 0.8016 | 0.8041 | 0.8066 | 0.8091 | 0.8116 |
| Woodie | 0.7632 | 0.7836 | 0.7905 | 0.8109 | 0.8178 | 0.8382 | 0.8451 |
| Fibonacci | 0.7859 | 0.7963 | 0.8028 | 0.8132 | 0.8236 | 0.8301 | 0.8405 |
Numerical data
The following is the status of technical indicators and moving averages registered at the time this technical analysis was created:
| RSI (14): | 53.69 | |
| MACD (12,26,9): | -0.0004 | |
| Directional Movement: | -0.3941 | |
| AROON (14): | 35.7143 | |
| DEMA (21): | 0.8145 | |
| Parabolic SAR (0,02-0,02-0,2): | 0.8133 | |
| Elder Ray (13): | 0.0008 | |
| Super Trend (3,10): | 0.8165 | |
| Zig ZAG (10): | 0.8159 | |
| VORTEX (21): | 0.9207 | |
| Stochastique (14,3,5): | 92.61 | |
| TEMA (21): | 0.8146 | |
| Williams %R (14): | -6.45 | |
| Chande Momentum Oscillator (20): | 0.0007 | |
| Repulse (5,40,3): | 0.1149 | |
| ROCnROLL: | -1 | |
| TRIX (15,9): | -0.0126 | |
| Courbe Coppock: | 0.05 |
| MA7: | 0.8151 | |
| MA20: | 0.8093 | |
| MA50: | 0.8159 | |
| MA100: | 0.8264 | |
| MAexp7: | 0.8151 | |
| MAexp20: | 0.8152 | |
| MAexp50: | 0.8160 | |
| MAexp100: | 0.8155 | |
| Price / MA7: | +0.07% | |
| Price / MA20: | +0.79% | |
| Price / MA50: | -0.02% | |
| Price / MA100: | -1.29% | |
| Price / MAexp7: | +0.07% | |
| Price / MAexp20: | +0.06% | |
| Price / MAexp50: | -0.04% | |
| Price / MAexp100: | +0.02% |
News
Don't forget to follow the news on NZD/CAD. At the time of publication of this analysis, the latest news was as follows:
-
 NZD/CAD Forecast September 6, 2024
-
Trading into 2024: Rules of Alternation in Elliot Wave using NZD/CAD
-
New Zealand Dollar Soars on RBNZ: NZD/USD, NZD/JPY, NZD/CAD Analysis
-
Quick Takes Video: Volatility vs Inevitability for USD/CAD, NZD/JPY, NZD/CAD
-
NZD/CAD To Potentially Reach Parity
About author
Online


Add a comment
Comments
0 comments on the analysis NZD/CAD - 1H