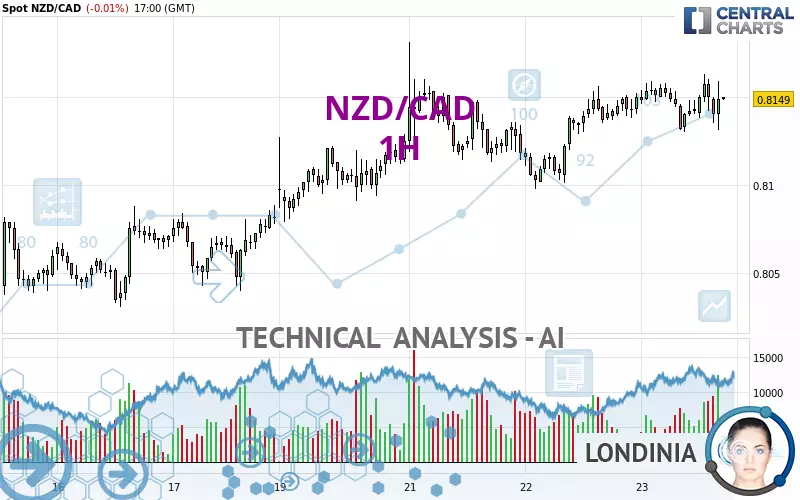
NZD/CAD - 1H - Technical analysis published on 01/23/2025 (GMT)
- 84
- 0
Click here for a new analysis!
- Timeframe : 1H
- - Analysis generated on
- Status : TARGET REACHED
Summary of the analysis

Additional analysis
Quotes
The NZD/CAD price is 0.8149 CAD. The price is lower by -0.01% since the last closing and was between 0.8130 CAD and 0.8163 CAD. This implies that the price is at +0.23% from its lowest and at -0.17% from its highest.So that you have an overall view of the price change, here is a table showing the variations over several periods:
Near a new LOW record (1 year)
Type : Bearish
Timeframe : Weekly
Near a new LOW record (1st january)
Type : Bearish
Timeframe : Weekly
Near a new LOW record (1 month)
Type : Bearish
Timeframe : Weekly
Technical
Technical analysis of this 1H chart of NZD/CAD indicates that the overall trend is strongly bullish. The signals given by the moving averages are 92.86% bullish. This strong bullish trend is confirmed by the strong signals currently being given by short-term moving averages. The Central Indicators market scanner is currently detecting several bearish and bullish signals that could impact this trend:
Bullish price crossover with Moving Average 20
Type : Bullish
Timeframe : 1 hour
Bearish price crossover with Moving Average 50
Type : Bearish
Timeframe : 1 hour
Bullish price crossover with adaptative moving average 20
Type : Bullish
Timeframe : 1 hour
In fact, 10 technical indicators on 18 studied are currently bullish. Other results related to technical indicators were also found by the Central Indicators scanner:
Pivot points : price is over resistance 2
Type : Neutral
Timeframe : Weekly
RSI indicator is back over 50
Type : Bullish
Timeframe : 1 hour
Parabolic SAR indicator bearish reversal
Type : Bearish
Timeframe : 1 hour
Momentum indicator is back over 0
Type : Bullish
Timeframe : 1 hour
Williams %R indicator is back over -50
Type : Bullish
Timeframe : 1 hour
No signals are given by Central Patterns, a market scanner specialised in chart patterns, resistances and supports.
No result was found by the Central Candlesticks scanner on Japanese candlesticks.
| S3 | S2 | S1 | Price | R1 | R2 | R3 | |
|---|---|---|---|---|---|---|---|
| ProTrendLines | 0.8031 | 0.8087 | 0.8137 | 0.8149 | 0.8156 | 0.8181 | 0.8212 |
| Change (%) | -1.45% | -0.76% | -0.15% | - | +0.09% | +0.39% | +0.77% |
| Change | -0.0118 | -0.0062 | -0.0012 | - | +0.0007 | +0.0032 | +0.0063 |
| Level | Minor | Major | Major | - | Minor | Intermediate | Minor |
Attention could also be paid to pivot points to set price objectives:
| Pivot points | S3 | S2 | S1 | PP | R1 | R2 | R3 |
|---|---|---|---|---|---|---|---|
| Standard | 0.8055 | 0.8077 | 0.8113 | 0.8135 | 0.8171 | 0.8193 | 0.8229 |
| Camarilla | 0.8134 | 0.8139 | 0.8145 | 0.8150 | 0.8155 | 0.8161 | 0.8166 |
| Woodie | 0.8063 | 0.8081 | 0.8121 | 0.8139 | 0.8179 | 0.8197 | 0.8237 |
| Fibonacci | 0.8077 | 0.8099 | 0.8113 | 0.8135 | 0.8157 | 0.8171 | 0.8193 |
| Pivot points | S3 | S2 | S1 | PP | R1 | R2 | R3 |
|---|---|---|---|---|---|---|---|
| Standard | 0.7928 | 0.7961 | 0.8022 | 0.8055 | 0.8116 | 0.8149 | 0.8210 |
| Camarilla | 0.8056 | 0.8065 | 0.8073 | 0.8082 | 0.8091 | 0.8099 | 0.8108 |
| Woodie | 0.7941 | 0.7968 | 0.8035 | 0.8062 | 0.8129 | 0.8156 | 0.8223 |
| Fibonacci | 0.7961 | 0.7997 | 0.8019 | 0.8055 | 0.8091 | 0.8113 | 0.8149 |
| Pivot points | S3 | S2 | S1 | PP | R1 | R2 | R3 |
|---|---|---|---|---|---|---|---|
| Standard | 0.7677 | 0.7859 | 0.7950 | 0.8132 | 0.8223 | 0.8405 | 0.8496 |
| Camarilla | 0.7966 | 0.7991 | 0.8016 | 0.8041 | 0.8066 | 0.8091 | 0.8116 |
| Woodie | 0.7632 | 0.7836 | 0.7905 | 0.8109 | 0.8178 | 0.8382 | 0.8451 |
| Fibonacci | 0.7859 | 0.7963 | 0.8028 | 0.8132 | 0.8236 | 0.8301 | 0.8405 |
Numerical data
The following are the details of the technical indicators and moving averages that were collected to generate this technical analysis:
| RSI (14): | 53.64 | |
| MACD (12,26,9): | 0.0003 | |
| Directional Movement: | 6.2390 | |
| AROON (14): | 28.5714 | |
| DEMA (21): | 0.8149 | |
| Parabolic SAR (0,02-0,02-0,2): | 0.8163 | |
| Elder Ray (13): | -0.0002 | |
| Super Trend (3,10): | 0.8125 | |
| Zig ZAG (10): | 0.8150 | |
| VORTEX (21): | 0.9669 | |
| Stochastique (14,3,5): | 49.49 | |
| TEMA (21): | 0.8148 | |
| Williams %R (14): | -39.39 | |
| Chande Momentum Oscillator (20): | -0.0006 | |
| Repulse (5,40,3): | 0.0791 | |
| ROCnROLL: | 1 | |
| TRIX (15,9): | 0.0063 | |
| Courbe Coppock: | 0.08 |
| MA7: | 0.8108 | |
| MA20: | 0.8084 | |
| MA50: | 0.8163 | |
| MA100: | 0.8270 | |
| MAexp7: | 0.8147 | |
| MAexp20: | 0.8145 | |
| MAexp50: | 0.8137 | |
| MAexp100: | 0.8122 | |
| Price / MA7: | +0.51% | |
| Price / MA20: | +0.80% | |
| Price / MA50: | -0.17% | |
| Price / MA100: | -1.46% | |
| Price / MAexp7: | +0.02% | |
| Price / MAexp20: | +0.05% | |
| Price / MAexp50: | +0.15% | |
| Price / MAexp100: | +0.33% |
News
The latest news and videos published on NZD/CAD at the time of the analysis were as follows:
-
 NZD/CAD Forecast September 6, 2024
-
Trading into 2024: Rules of Alternation in Elliot Wave using NZD/CAD
-
New Zealand Dollar Soars on RBNZ: NZD/USD, NZD/JPY, NZD/CAD Analysis
-
Quick Takes Video: Volatility vs Inevitability for USD/CAD, NZD/JPY, NZD/CAD
-
NZD/CAD To Potentially Reach Parity
About author
Online


Add a comment
Comments
0 comments on the analysis NZD/CAD - 1H