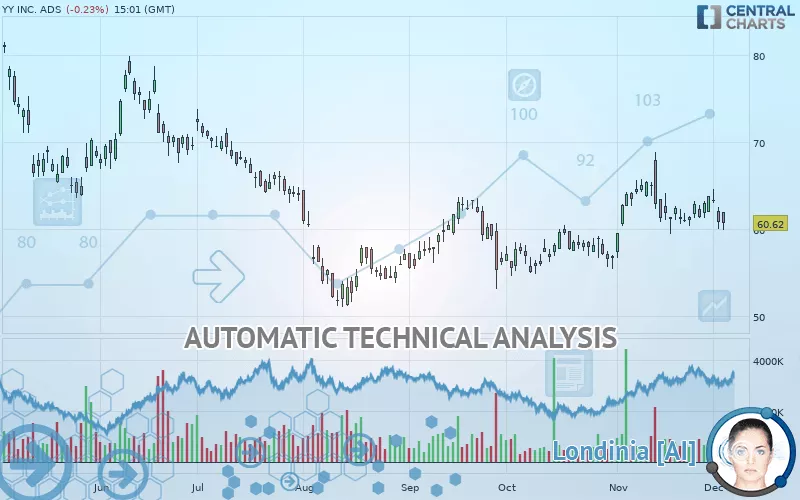
JOYY INC. ADS - Daily - Technical analysis published on 12/04/2019 (GMT)
- 223
- 0
- Who voted?
Click here for a new analysis!
- Timeframe : Daily
- - Analysis generated on
- Status : TARGET REACHED
Summary of the analysis

Additional analysis
Quotes
YY INC. ADS rating 60.62 USD. The price registered a decrease of -0.23% on the session with the lowest point at 59.89 USD and the highest point at 61.90 USD. The deviation from the price is +1.22% for the low point and -2.07% for the high point.The Central Gaps scanner detects a bullish opening marking the presence of buyers ahead of sellers at the opening but not sufficiently marked to allow the price to register a quotation gap.
Bullish opening
Type : Bullish
Timeframe : Openning
So that you have an overall view of the price change, here is a table showing the variations over several periods:
Technical
A technical analysis in Daily of this YY INC. ADS chart shows a slightly bearish trend. 57.14% of the signals given by moving averages are bearish. The overall trend remains fragile, reflecting the slightly bearish signals given by short-term moving averages. The Central Indicators market scanner is currently detecting several bearish signals that could impact this trend:
Bearish trend reversal : Moving Average 20
Type : Bearish
Timeframe : Daily
Bearish trend reversal : adaptative moving average 20
Type : Bearish
Timeframe : Daily
Bearish trend reversal : adaptative moving average 50
Type : Bearish
Timeframe : Daily
Bearish price crossover with adaptative moving average 100
Type : Bearish
Timeframe : Daily
Technical indicators are slightly bearish. There is therefore considerable uncertainty about the continuation of the decline.
Central Indicators, the detector scanner for these technical indicators has recently detected several signals:
Pivot points : price is under support 2
Type : Neutral
Timeframe : Weekly
RSI indicator is back under 50
Type : Bearish
Timeframe : Daily
Price is back over the pivot point
Type : Bullish
Timeframe : Weekly
Price is back under the pivot point
Type : Bearish
Timeframe : Daily
Momentum indicator is back over 0
Type : Bullish
Timeframe : Daily
Central Patterns, the market scanner focusing on chart patterns, resistances and supports found this result:
Support of triangle is broken
Type : Bearish
Timeframe : Daily
No result was found by the Central Candlesticks scanner on Japanese candlesticks.
| S3 | S2 | S1 | Price | R1 | R2 | R3 | |
|---|---|---|---|---|---|---|---|
| ProTrendLines | 38.10 | 51.77 | 56.74 | 60.62 | 63.99 | 68.77 | 78.00 |
| Change (%) | -37.15% | -14.60% | -6.40% | - | +5.56% | +13.44% | +28.67% |
| Change | -22.52 | -8.85 | -3.88 | - | +3.37 | +8.15 | +17.38 |
| Level | Minor | Minor | Major | - | Intermediate | Intermediate | Minor |
Attention could also be paid to pivot points to set price objectives:
| Pivot points | S3 | S2 | S1 | PP | R1 | R2 | R3 |
|---|---|---|---|---|---|---|---|
| Standard | 57.27 | 58.65 | 59.71 | 61.09 | 62.15 | 63.53 | 64.59 |
| Camarilla | 60.09 | 60.31 | 60.54 | 60.76 | 60.98 | 61.21 | 61.43 |
| Woodie | 60.95 | 61.99 | 59.54 | 61.01 | 61.98 | 63.45 | 64.42 |
| Fibonacci | 62.07 | 62.68 | 63.06 | 63.67 | 64.28 | 64.66 | 65.27 |
| Pivot points | S3 | S2 | S1 | PP | R1 | R2 | R3 |
|---|---|---|---|---|---|---|---|
| Standard | 59.41 | 60.30 | 62.05 | 62.94 | 64.69 | 65.58 | 67.33 |
| Camarilla | 63.06 | 63.31 | 63.55 | 63.79 | 64.03 | 64.27 | 64.52 |
| Woodie | 59.83 | 60.52 | 62.47 | 63.16 | 65.11 | 65.80 | 67.75 |
| Fibonacci | 60.30 | 61.31 | 61.94 | 62.94 | 63.95 | 64.58 | 65.58 |
| Pivot points | S3 | S2 | S1 | PP | R1 | R2 | R3 |
|---|---|---|---|---|---|---|---|
| Standard | 45.12 | 50.90 | 57.34 | 63.12 | 69.56 | 75.34 | 81.78 |
| Camarilla | 60.43 | 61.55 | 62.67 | 63.79 | 64.91 | 66.03 | 67.15 |
| Woodie | 45.46 | 51.07 | 57.68 | 63.29 | 69.90 | 75.51 | 82.12 |
| Fibonacci | 50.90 | 55.57 | 58.45 | 63.12 | 67.79 | 70.67 | 75.34 |
Numerical data
The following are the details of the technical indicators and moving averages that were collected to generate this technical analysis:
| RSI (14): | 46.88 | |
| MACD (12,26,9): | 0.4200 | |
| Directional Movement: | 3.38 | |
| AROON (14): | -21.43 | |
| DEMA (21): | 62.48 | |
| Parabolic SAR (0,02-0,02-0,2): | 66.99 | |
| Elder Ray (13): | -1.03 | |
| Super Trend (3,10): | 59.11 | |
| Zig ZAG (10): | 60.76 | |
| VORTEX (21): | 1.0300 | |
| Stochastique (14,3,5): | 34.35 | |
| TEMA (21): | 62.66 | |
| Williams %R (14): | -85.31 | |
| Chande Momentum Oscillator (20): | -0.50 | |
| Repulse (5,40,3): | -0.7600 | |
| ROCnROLL: | 2 | |
| TRIX (15,9): | 0.2000 | |
| Courbe Coppock: | 4.02 |
| MA7: | 62.19 | |
| MA20: | 62.60 | |
| MA50: | 59.81 | |
| MA100: | 59.48 | |
| MAexp7: | 61.71 | |
| MAexp20: | 61.75 | |
| MAexp50: | 60.88 | |
| MAexp100: | 61.74 | |
| Price / MA7: | -2.52% | |
| Price / MA20: | -3.16% | |
| Price / MA50: | +1.35% | |
| Price / MA100: | +1.92% | |
| Price / MAexp7: | -1.77% | |
| Price / MAexp20: | -1.83% | |
| Price / MAexp50: | -0.43% | |
| Price / MAexp100: | -1.81% |
News
Don"t forget to follow the news on YY INC. ADS. At the time of publication of this analysis, the latest news was as follows:
- 650 Group Finds Data Center Equipment CAPEX for the US Hyperscalers Grows 10% Y/Y in 3Q19
- IoT and AI will Drive Further WLAN Growth; 802.11ax WLAN Infrastructure Market Shows 5% Y/Y Growth Following a Period of Acquisitions, According to 650 Group
- Ethernet Switch Market Hits $7.5B in 1Q‘19, According to 650 Group; Campus Switching, North America, and China Drive Robust Y/Y Growth
- YY Announces Completion of Acquisition of Bigo, Ping An Overseas Holdings was the Exclusive Investor in Bigo's Series C Round Funding
- Report: Developing Opportunities within YY, Ingredion, Standex International, Graham, Cooper-Standard, and Titan Machinery — Future Expectations, Projections Moving into 2018
About author

Online


Add a comment
Comments
0 comments on the analysis JOYY INC. ADS - Daily