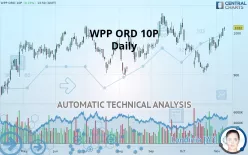
WPP ORD 10P - Daily - Technical analysis published on 11/08/2019 (GMT)
- 363
- 0
- Who voted?
Click here for a new analysis!
- Timeframe : Daily
- - Analysis generated on
- Status : INVALID

Summary of the analysis

Additional analysis
Quotes
The WPP ORD 10P price is 1,012.0 GBX. The price registered an increase of +0.25% on the session with the lowest point at 1,004.5 GBX and the highest point at 1,014.5 GBX. The deviation from the price is +0.75% for the low point and -0.25% for the high point.The Central Gaps scanner detects a bearish opening. A small advantage for sellers in the very short term.
Bearish opening
Type : Bearish
Timeframe : Openning
A study of price movements over other periods shows the following variations:
Near a new HIGH record (1st january)
Type : Bullish
Timeframe : Weekly
Technical
Technical analysis of this Daily chart of WPP ORD 10P indicates that the overall trend is strongly bullish. 89.29% of the signals given by moving averages are bullish. The overall trend is supported by the strong bullish signals from short-term moving averages. The Central Indicators market scanner currently does not detect any result that concerns moving averages.
Technical indicators are strongly bullish, suggesting that the price increase should continue.
Caution: the Central Indicators scanner currently detects an excess:
CCI indicator is overbought : over 100
Type : Neutral
Timeframe : Daily
Williams %R indicator is overbought : over -20
Type : Neutral
Timeframe : Daily
Pivot points : price is over resistance 2
Type : Neutral
Timeframe : Weekly
Price is back over the pivot point
Type : Bullish
Timeframe : Daily
Price is back under the pivot point
Type : Bearish
Timeframe : Weekly
The Central Patterns scanner, which studies chart patterns, resistances and supports, has identified these signals:
Horizontal resistance is broken
Type : Bullish
Timeframe : Daily
Resistance of channel is broken
Type : Bullish
Timeframe : Daily
For a small rebound in the very short term, the Central Candlesticks scanner currently notes the presence of this bullish pattern in Japanese candlesticks:
Bullish engulfing lines
Type : Bullish
Timeframe : Daily
| S3 | S2 | S1 | Price | R1 | R2 | R3 | |
|---|---|---|---|---|---|---|---|
| ProTrendLines | 904.6 | 940.5 | 977.4 | 1,012.0 | 1,018.0 | 1,038.0 | 1,117.0 |
| Change (%) | -10.61% | -7.07% | -3.42% | - | +0.59% | +2.57% | +10.38% |
| Change | -107.4 | -71.5 | -34.6 | - | +6.0 | +26.0 | +105.0 |
| Level | Intermediate | Minor | Minor | - | Minor | Intermediate | Intermediate |
Attention could also be paid to pivot points to set price objectives:
| Pivot points | S3 | S2 | S1 | PP | R1 | R2 | R3 |
|---|---|---|---|---|---|---|---|
| Standard | 978.7 | 985.4 | 997.5 | 1,004.2 | 1,016.3 | 1,023.0 | 1,035.1 |
| Camarilla | 1,004.3 | 1,006.1 | 1,007.8 | 1,009.5 | 1,011.2 | 1,013.0 | 1,014.7 |
| Woodie | 981.3 | 986.8 | 1,000.1 | 1,005.6 | 1,018.9 | 1,024.4 | 1,037.7 |
| Fibonacci | 985.4 | 992.6 | 997.1 | 1,004.2 | 1,011.4 | 1,015.9 | 1,023.0 |
| Pivot points | S3 | S2 | S1 | PP | R1 | R2 | R3 |
|---|---|---|---|---|---|---|---|
| Standard | 911.2 | 931.8 | 948.6 | 969.2 | 986.0 | 1,006.6 | 1,023.4 |
| Camarilla | 955.1 | 958.5 | 962.0 | 965.4 | 968.8 | 972.3 | 975.7 |
| Woodie | 909.3 | 930.9 | 946.7 | 968.3 | 984.1 | 1,005.7 | 1,021.5 |
| Fibonacci | 931.8 | 946.1 | 954.9 | 969.2 | 983.5 | 992.3 | 1,006.6 |
| Pivot points | S3 | S2 | S1 | PP | R1 | R2 | R3 |
|---|---|---|---|---|---|---|---|
| Standard | 803.0 | 853.8 | 908.5 | 959.3 | 1,014.0 | 1,064.8 | 1,119.6 |
| Camarilla | 934.2 | 943.9 | 953.5 | 963.2 | 972.9 | 982.6 | 992.2 |
| Woodie | 804.9 | 854.8 | 910.4 | 960.3 | 1,016.0 | 1,065.8 | 1,121.5 |
| Fibonacci | 853.8 | 894.1 | 919.0 | 959.3 | 999.6 | 1,024.5 | 1,064.8 |
Numerical data
The following is the status of technical indicators and moving averages registered at the time this technical analysis was created:
| RSI (14): | 65.00 | |
| MACD (12,26,9): | 12.2000 | |
| Directional Movement: | 19.4 | |
| AROON (14): | 100.0 | |
| DEMA (21): | 984.0 | |
| Parabolic SAR (0,02-0,02-0,2): | 949.2 | |
| Elder Ray (13): | 30.4 | |
| Super Trend (3,10): | 953.2 | |
| Zig ZAG (10): | 1,011.5 | |
| VORTEX (21): | 1.0000 | |
| Stochastique (14,3,5): | 96.00 | |
| TEMA (21): | 995.8 | |
| Williams %R (14): | -2.30 | |
| Chande Momentum Oscillator (20): | 91.2 | |
| Repulse (5,40,3): | 2.0000 | |
| ROCnROLL: | 1 | |
| TRIX (15,9): | 0.1000 | |
| Courbe Coppock: | 14.10 |
| MA7: | 986.7 | |
| MA20: | 957.8 | |
| MA50: | 966.4 | |
| MA100: | 951.6 | |
| MAexp7: | 992.0 | |
| MAexp20: | 971.8 | |
| MAexp50: | 961.2 | |
| MAexp100: | 945.5 | |
| Price / MA7: | +2.56% | |
| Price / MA20: | +5.66% | |
| Price / MA50: | +4.72% | |
| Price / MA100: | +6.35% | |
| Price / MAexp7: | +2.02% | |
| Price / MAexp20: | +4.14% | |
| Price / MAexp50: | +5.29% | |
| Price / MAexp100: | +7.03% |
News
The latest news and videos published on WPP ORD 10P at the time of the analysis were as follows:
- WPP Health & Wellness Co-Hosts LIGHT Forum Focused on the Impact and Opportunities Driven by Artificial Intelligence and Machine Learning
- WPP Agrees to Acquire Majority Stake in Bruketa&Zinic OM
- WPP Agrees to Acquire Majority Stake in Bruketa&Zinic OM
-
 WPP
WPP
- SHAREHOLDER ALERT: Bronstein, Gewirtz & Grossman, LLC Announces Investigation of WPP plc (WPPGY)
About author

Online


Add a comment
Comments
0 comments on the analysis WPP ORD 10P - Daily