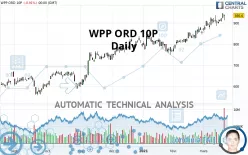
WPP ORD 10P - Daily - Technical analysis published on 03/21/2021 (GMT)
- 376
- 0
Click here for a new analysis!
- Timeframe : Daily
- - Analysis generated on
- Status : LEVEL MAINTAINED

Summary of the analysis

Additional analysis
Quotes
The WPP ORD 10P price is 935.6 GBX. The price registered a decrease of -0.91% on the session with the lowest point at 912.0 GBX and the highest point at 939.0 GBX. The deviation from the price is +2.59% for the low point and -0.36% for the high point.The Central Gaps scanner detects a bearish opening. A small advantage for sellers in the very short term.
Bearish opening
Type : Bearish
Timeframe : Openning
A study of price movements over other periods shows the following variations:
Near a new HIGH record (1st january)
Type : Bullish
Timeframe : Weekly
Near a new HIGH record (1 month)
Type : Bullish
Timeframe : Weekly
Technical
A technical analysis in Daily of this WPP ORD 10P chart shows a strongly bullish trend. 92.86% of the signals given by moving averages are bullish. The overall trend is supported by the strong bullish signals from short-term moving averages. There is no crossing of moving average by the price or crossing of moving averages between themselves.
Technical indicators are strongly bullish, suggesting that the price increase should continue.
But beware of excesses. The Central Indicators scanner currently detects this:
CCI indicator: bearish divergence
Type : Bearish
Timeframe : Daily
Pivot points : price is over resistance 1
Type : Neutral
Timeframe : Weekly
Pivot points : price is over resistance 3
Type : Neutral
Timeframe : Daily
An analysis of the price chart with the Central Patterns scanner (detector of chart patterns and resistances and supports) shows a result that can have an impact on the price change:
Near support of channel
Type : Bullish
Timeframe : Daily
The Central Candlesticks scanner which studies Japanese candlesticks did not detect anything.
| S3 | S2 | S1 | Price | R1 | R2 | R3 | |
|---|---|---|---|---|---|---|---|
| ProTrendLines | 664.8 | 791.8 | 906.3 | 935.6 | 1,080.8 | 1,383.0 | 1,611.0 |
| Change (%) | -28.94% | -15.37% | -3.13% | - | +15.52% | +47.82% | +72.19% |
| Change | -270.8 | -143.8 | -29.3 | - | +145.2 | +447.4 | +675.4 |
| Level | Minor | Major | Major | - | Major | Intermediate | Minor |
To determine price objectives, it is also possible to use the pivot points. Here is the price position in relation to pivot points:
| Pivot points | S3 | S2 | S1 | PP | R1 | R2 | R3 |
|---|---|---|---|---|---|---|---|
| Standard | 891.7 | 901.9 | 918.7 | 928.9 | 945.7 | 955.9 | 972.7 |
| Camarilla | 928.2 | 930.7 | 933.1 | 935.6 | 938.1 | 940.6 | 943.0 |
| Woodie | 895.1 | 903.6 | 922.1 | 930.6 | 949.1 | 957.6 | 976.1 |
| Fibonacci | 901.9 | 912.2 | 918.6 | 928.9 | 939.2 | 945.6 | 955.9 |
| Pivot points | S3 | S2 | S1 | PP | R1 | R2 | R3 |
|---|---|---|---|---|---|---|---|
| Standard | 859.1 | 878.9 | 907.3 | 927.1 | 955.5 | 975.3 | 1,003.7 |
| Camarilla | 922.4 | 926.8 | 931.2 | 935.6 | 940.0 | 944.4 | 948.9 |
| Woodie | 863.3 | 881.1 | 911.5 | 929.3 | 959.7 | 977.5 | 1,007.9 |
| Fibonacci | 878.9 | 897.4 | 908.7 | 927.1 | 945.6 | 956.9 | 975.3 |
| Pivot points | S3 | S2 | S1 | PP | R1 | R2 | R3 |
|---|---|---|---|---|---|---|---|
| Standard | 664.6 | 713.8 | 783.8 | 833.0 | 903.0 | 952.2 | 1,022.2 |
| Camarilla | 821.0 | 832.0 | 842.9 | 853.8 | 864.7 | 875.7 | 886.6 |
| Woodie | 675.0 | 719.0 | 794.2 | 838.2 | 913.4 | 957.4 | 1,032.6 |
| Fibonacci | 713.8 | 759.3 | 787.5 | 833.0 | 878.5 | 906.7 | 952.2 |
Numerical data
The following is the status of the technical indicators and moving averages at the time of publication of this technical analysis:
| RSI (14): | 65.90 | |
| MACD (12,26,9): | 23.6000 | |
| Directional Movement: | 16.3 | |
| AROON (14): | 64.3 | |
| DEMA (21): | 918.9 | |
| Parabolic SAR (0,02-0,02-0,2): | 886.5 | |
| Elder Ray (13): | 14.8 | |
| Super Trend (3,10): | 846.3 | |
| Zig ZAG (10): | 921.0 | |
| VORTEX (21): | 1.1000 | |
| Stochastique (14,3,5): | 74.50 | |
| TEMA (21): | 925.0 | |
| Williams %R (14): | -16.90 | |
| Chande Momentum Oscillator (20): | 47.4 | |
| Repulse (5,40,3): | 2.6000 | |
| ROCnROLL: | 1 | |
| TRIX (15,9): | 0.4000 | |
| Courbe Coppock: | 11.70 |
| MA7: | 911.0 | |
| MA20: | 886.8 | |
| MA50: | 838.9 | |
| MA100: | 790.6 | |
| MAexp7: | 909.9 | |
| MAexp20: | 887.6 | |
| MAexp50: | 847.3 | |
| MAexp100: | 797.6 | |
| Price / MA7: | +2.70% | |
| Price / MA20: | +5.50% | |
| Price / MA50: | +11.53% | |
| Price / MA100: | +18.34% | |
| Price / MAexp7: | +2.82% | |
| Price / MAexp20: | +5.41% | |
| Price / MAexp50: | +10.42% | |
| Price / MAexp100: | +17.30% |
News
Don"t forget to follow the news on WPP ORD 10P. At the time of publication of this analysis, the latest news was as follows:
- WPP Health & Wellness Co-Hosts LIGHT Forum Focused on the Impact and Opportunities Driven by Artificial Intelligence and Machine Learning
- WPP Agrees to Acquire Majority Stake in Bruketa&Zinic OM
- WPP Agrees to Acquire Majority Stake in Bruketa&Zinic OM
-
 WPP
WPP
- SHAREHOLDER ALERT: Bronstein, Gewirtz & Grossman, LLC Announces Investigation of WPP plc (WPPGY)
About author

Online


Add a comment
Comments
0 comments on the analysis WPP ORD 10P - Daily