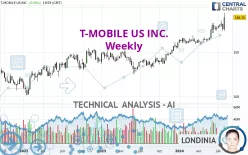
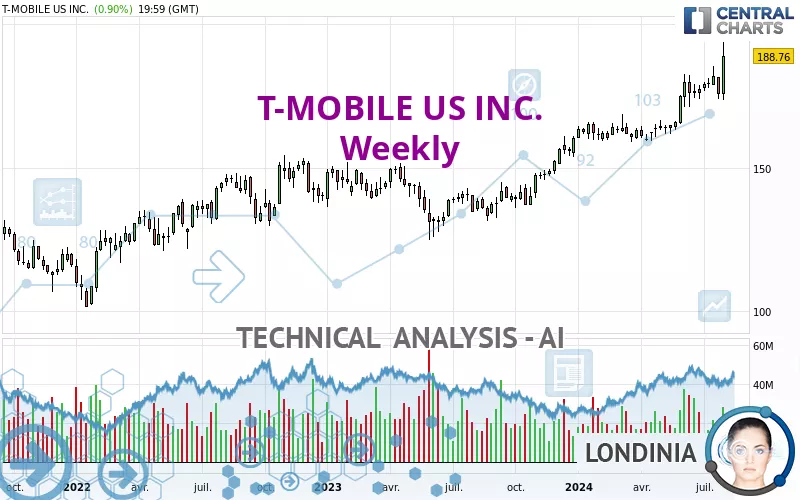
T-MOBILE US INC. - Weekly - Technical analysis published on 08/04/2024 (GMT)
- 175
- 0
Click here for a new analysis!
- Timeframe : Weekly
- - Analysis generated on
- Status : TARGET REACHED
Summary of the analysis

Additional analysis
Quotes
The T-MOBILE US INC. price is 188.76 USD. The price registered an increase of +7.54% over 5 days and was traded between 176.89 USD and 193.77 USD over the period. The price is currently at +6.71% from its lowest point and -2.59% from its highest point.The Central Gaps scanner detects the formation of a bullish gap marking the strong presence of buyers against sellers at the opening. This formed a quotation gap.
Opening Gap UP
Type : Bullish
Timeframe : Openning
So that you have an overall view of the price change, here is a table showing the variations over several periods:
New HIGH record (5 years)
Type : Bullish
Timeframe : Weekly
New HIGH record (1 year)
Type : Bullish
Timeframe : Weekly
New HIGH record (1st january)
Type : Bullish
Timeframe : Weekly
New HIGH record (1 month)
Type : Bullish
Timeframe : Weekly
Technical
Technical analysis of T-MOBILE US INC. in Weekly shows a strongly overall bullish trend. The signals given by the moving averages are 92.86% bullish. This strong bullish trend is confirmed by the strong signals currently being given by short-term moving averages. There is no crossing of moving average by the price or crossing of moving averages between themselves.
In fact, 15 technical indicators on 18 studied are currently bullish. Caution: the Central Indicators scanner currently detects an excess:
RSI indicator is overbought : over 70
Type : Neutral
Timeframe : Weekly
CCI indicator is overbought : over 100
Type : Neutral
Timeframe : Weekly
Williams %R indicator is overbought : over -20
Type : Neutral
Timeframe : Weekly
Pivot points : price is over resistance 3
Type : Neutral
Timeframe : Weekly
Central Patterns, the market scanner focusing on chart patterns, resistances and supports found this result:
Near horizontal support
Type : Bullish
Timeframe : Weekly
The presence of a bullish Japanese candlestick pattern detected by Central Candlesticks that could cause a very short term rebound was also detected:
Long white line
Type : Bullish
Timeframe : Weekly
| S3 | S2 | S1 | Price | |
|---|---|---|---|---|
| ProTrendLines | 150.57 | 166.78 | 180.69 | 188.76 |
| Change (%) | -20.23% | -11.64% | -4.28% | - |
| Change | -38.19 | -21.98 | -8.07 | - |
| Level | Major | Intermediate | Major | - |
Attention could also be paid to pivot points to set price objectives:
| Pivot points | S3 | S2 | S1 | PP | R1 | R2 | R3 |
|---|---|---|---|---|---|---|---|
| Standard | 181.31 | 184.81 | 186.78 | 190.28 | 192.25 | 195.75 | 197.72 |
| Camarilla | 187.26 | 187.76 | 188.26 | 188.76 | 189.26 | 189.76 | 190.26 |
| Woodie | 180.56 | 184.43 | 186.03 | 189.90 | 191.50 | 195.37 | 196.97 |
| Fibonacci | 184.81 | 186.90 | 188.19 | 190.28 | 192.37 | 193.66 | 195.75 |
| Pivot points | S3 | S2 | S1 | PP | R1 | R2 | R3 |
|---|---|---|---|---|---|---|---|
| Standard | 164.50 | 169.16 | 172.35 | 177.01 | 180.20 | 184.86 | 188.05 |
| Camarilla | 173.37 | 174.09 | 174.81 | 175.53 | 176.25 | 176.97 | 177.69 |
| Woodie | 163.76 | 168.79 | 171.61 | 176.64 | 179.46 | 184.49 | 187.31 |
| Fibonacci | 169.16 | 172.16 | 174.02 | 177.01 | 180.01 | 181.87 | 184.86 |
| Pivot points | S3 | S2 | S1 | PP | R1 | R2 | R3 |
|---|---|---|---|---|---|---|---|
| Standard | 163.86 | 168.80 | 175.54 | 180.48 | 187.22 | 192.16 | 198.90 |
| Camarilla | 179.07 | 180.14 | 181.21 | 182.28 | 183.35 | 184.42 | 185.49 |
| Woodie | 164.76 | 169.25 | 176.44 | 180.93 | 188.12 | 192.61 | 199.80 |
| Fibonacci | 168.80 | 173.26 | 176.02 | 180.48 | 184.94 | 187.70 | 192.16 |
Numerical data
The following is the status of the technical indicators and moving averages at the time of publication of this technical analysis:
| RSI (14): | 72.63 | |
| MACD (12,26,9): | 6.8700 | |
| Directional Movement: | 29.23 | |
| AROON (14): | 100.00 | |
| DEMA (21): | 181.40 | |
| Parabolic SAR (0,02-0,02-0,2): | 166.33 | |
| Elder Ray (13): | 7.55 | |
| Super Trend (3,10): | 165.90 | |
| Zig ZAG (10): | 188.76 | |
| VORTEX (21): | 1.0900 | |
| Stochastique (14,3,5): | 77.76 | |
| TEMA (21): | 183.38 | |
| Williams %R (14): | -15.27 | |
| Chande Momentum Oscillator (20): | 25.19 | |
| Repulse (5,40,3): | 6.6200 | |
| ROCnROLL: | 1 | |
| TRIX (15,9): | 0.5400 | |
| Courbe Coppock: | 22.29 |
| MA7: | 180.14 | |
| MA20: | 180.08 | |
| MA50: | 177.23 | |
| MA100: | 169.53 | |
| MAexp7: | 179.99 | |
| MAexp20: | 172.59 | |
| MAexp50: | 161.87 | |
| MAexp100: | 151.40 | |
| Price / MA7: | +4.79% | |
| Price / MA20: | +4.82% | |
| Price / MA50: | +6.51% | |
| Price / MA100: | +11.34% | |
| Price / MAexp7: | +4.87% | |
| Price / MAexp20: | +9.37% | |
| Price / MAexp50: | +16.61% | |
| Price / MAexp100: | +24.68% |
News
The last news published on T-MOBILE US INC. at the time of the generation of this analysis was as follows:
- T-Mobile's Hometown Grants Spark Positive Change in 25 New Communities
- Introducing “Nada Yada Yada”: Metro by T-Mobile's BS-Free Promise
- T-Mobile Unveils Go5G Next, A New Plan that Guarantees the Freedom to Upgrade Every Year
- T-Mobile Expands REVVL Lineup with First-Ever Tablet and New 5G Smartphones
- T-Mobile Expands 5G Network Coverage in Pennsylvania
About author

Online


Add a comment
Comments
0 comments on the analysis T-MOBILE US INC. - Weekly