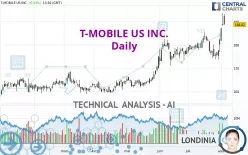
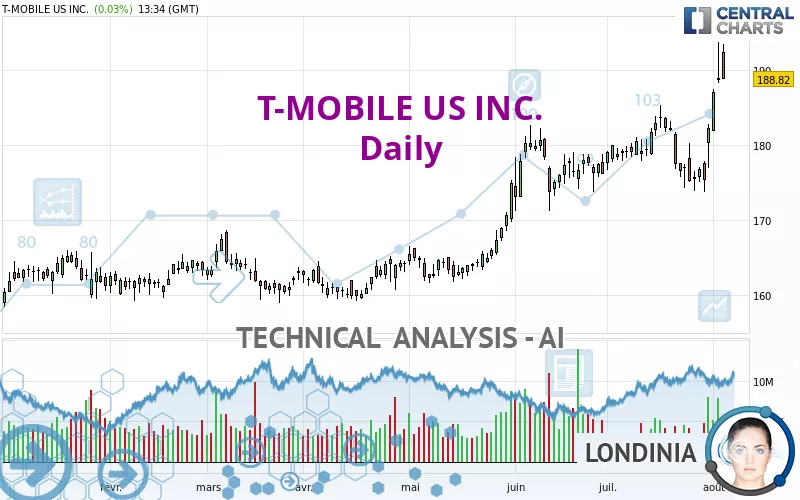
T-MOBILE US INC. - Daily - Technical analysis published on 08/05/2024 (GMT)
- 193
- 0
Click here for a new analysis!
- Timeframe : Daily
- - Analysis generated on
- Status : TARGET REACHED
Summary of the analysis

Additional analysis
Quotes
T-MOBILE US INC. rating 188.82 USD. On the day, this instrument gained +0.03% and was between 188.82 USD and 193.48 USD. This implies that the price is at 0% from its lowest and at -2.41% from its highest.The Central Gaps scanner detects the formation of a bullish gap marking the strong presence of buyers against sellers at the opening. This formed a quotation gap.
Opening Gap UP
Type : Bullish
Timeframe : Openning
A study of price movements over other periods shows the following variations:
New HIGH record (5 years)
Type : Bullish
Timeframe : Weekly
New HIGH record (1 year)
Type : Bullish
Timeframe : Weekly
New HIGH record (1st january)
Type : Bullish
Timeframe : Weekly
New HIGH record (1 month)
Type : Bullish
Timeframe : Weekly
Technical
A technical analysis in Daily of this T-MOBILE US INC. chart shows a strongly bullish trend. 92.86% of the signals given by moving averages are bullish. This strongly bullish trend is supported by the strong bullish signals given by short-term moving averages. The Central Indicators market scanner currently does not detect any result that concerns moving averages.
In fact, 14 technical indicators on 18 studied are currently positioned bullish. But beware of excesses. The Central Indicators scanner currently detects this:
CCI indicator is overbought : over 100
Type : Neutral
Timeframe : Daily
Pivot points : price is over resistance 3
Type : Neutral
Timeframe : Weekly
An analysis of the price chart with the Central Patterns scanner (detector of chart patterns and resistances and supports) shows several results that can have an impact on the price change:
Near resistance of channel
Type : Bearish
Timeframe : Daily
Near horizontal support
Type : Bullish
Timeframe : Daily
The Central Candlesticks scanner currently notes the presence of this pattern in Japanese candlesticks that could mark the end of the short-term trend currently underway:
Doji
Type : Neutral
Timeframe : Daily
| S3 | S2 | S1 | Price | |
|---|---|---|---|---|
| ProTrendLines | 166.78 | 175.14 | 180.69 | 188.82 |
| Change (%) | -11.67% | -7.24% | -4.31% | - |
| Change | -22.04 | -13.68 | -8.13 | - |
| Level | Intermediate | Intermediate | Major | - |
Pivot points can also be used to set your price objectives. Here is the price situation in relation to pivot points:
| Pivot points | S3 | S2 | S1 | PP | R1 | R2 | R3 |
|---|---|---|---|---|---|---|---|
| Standard | 181.31 | 184.81 | 186.78 | 190.28 | 192.25 | 195.75 | 197.72 |
| Camarilla | 187.26 | 187.76 | 188.26 | 188.76 | 189.26 | 189.76 | 190.26 |
| Woodie | 180.56 | 184.43 | 186.03 | 189.90 | 191.50 | 195.37 | 196.97 |
| Fibonacci | 184.81 | 186.90 | 188.19 | 190.28 | 192.37 | 193.66 | 195.75 |
| Pivot points | S3 | S2 | S1 | PP | R1 | R2 | R3 |
|---|---|---|---|---|---|---|---|
| Standard | 157.05 | 165.39 | 177.08 | 185.42 | 197.11 | 205.45 | 217.14 |
| Camarilla | 183.25 | 185.09 | 186.92 | 188.76 | 190.60 | 192.43 | 194.27 |
| Woodie | 158.72 | 166.23 | 178.75 | 186.26 | 198.78 | 206.29 | 218.81 |
| Fibonacci | 165.39 | 173.05 | 177.77 | 185.42 | 193.08 | 197.80 | 205.45 |
| Pivot points | S3 | S2 | S1 | PP | R1 | R2 | R3 |
|---|---|---|---|---|---|---|---|
| Standard | 163.86 | 168.80 | 175.54 | 180.48 | 187.22 | 192.16 | 198.90 |
| Camarilla | 179.07 | 180.14 | 181.21 | 182.28 | 183.35 | 184.42 | 185.49 |
| Woodie | 164.76 | 169.25 | 176.44 | 180.93 | 188.12 | 192.61 | 199.80 |
| Fibonacci | 168.80 | 173.26 | 176.02 | 180.48 | 184.94 | 187.70 | 192.16 |
Numerical data
The following are the details of the technical indicators and moving averages that were collected to generate this technical analysis:
| RSI (14): | 69.41 | |
| MACD (12,26,9): | 1.6700 | |
| Directional Movement: | 26.14 | |
| AROON (14): | 21.43 | |
| DEMA (21): | 182.11 | |
| Parabolic SAR (0,02-0,02-0,2): | 174.29 | |
| Elder Ray (13): | 10.14 | |
| Super Trend (3,10): | 179.15 | |
| Zig ZAG (10): | 188.76 | |
| VORTEX (21): | 1.1100 | |
| Stochastique (14,3,5): | 81.64 | |
| TEMA (21): | 182.08 | |
| Williams %R (14): | -25.01 | |
| Chande Momentum Oscillator (20): | 5.20 | |
| Repulse (5,40,3): | 1.3500 | |
| ROCnROLL: | 1 | |
| TRIX (15,9): | 0.0700 | |
| Courbe Coppock: | 0.46 |
| MA7: | 180.14 | |
| MA20: | 180.08 | |
| MA50: | 177.23 | |
| MA100: | 169.53 | |
| MAexp7: | 182.48 | |
| MAexp20: | 180.05 | |
| MAexp50: | 176.55 | |
| MAexp100: | 171.23 | |
| Price / MA7: | +4.82% | |
| Price / MA20: | +4.85% | |
| Price / MA50: | +6.54% | |
| Price / MA100: | +11.38% | |
| Price / MAexp7: | +3.47% | |
| Price / MAexp20: | +4.87% | |
| Price / MAexp50: | +6.95% | |
| Price / MAexp100: | +10.27% |
News
The latest news and videos published on T-MOBILE US INC. at the time of the analysis were as follows:
- T-Mobile's Hometown Grants Spark Positive Change in 25 New Communities
- Introducing “Nada Yada Yada”: Metro by T-Mobile's BS-Free Promise
- T-Mobile Unveils Go5G Next, A New Plan that Guarantees the Freedom to Upgrade Every Year
- T-Mobile Expands REVVL Lineup with First-Ever Tablet and New 5G Smartphones
- T-Mobile Expands 5G Network Coverage in Pennsylvania
About author

Online


Add a comment
Comments
0 comments on the analysis T-MOBILE US INC. - Daily