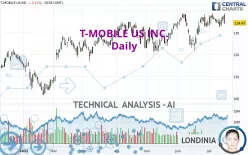
T-MOBILE US INC. - Daily - Technical analysis published on 07/18/2022 (GMT)
- 291
- 0
Click here for a new analysis!
- Timeframe : Daily
- - Analysis generated on
- Status : TARGET REACHED
Summary of the analysis

Additional analysis
Quotes
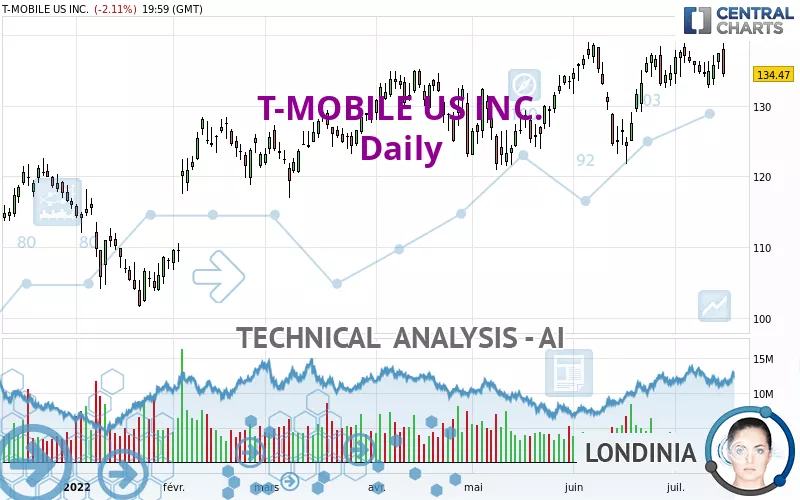
The T-MOBILE US INC. rating is 134.47 USD. On the day, this instrument lost -2.11% with the lowest point at 134.09 USD and the highest point at 138.80 USD. The deviation from the price is +0.28% for the low point and -3.12% for the high point.The Central Gaps scanner detects a bullish gap which is a sign that buyers have taken the lead in the very short term.
Opening Gap UP
Type : Bullish
Timeframe : Openning
So that you have an overall view of the price change, here is a table showing the variations over several periods:
Near a new HIGH record (1st january)
Type : Bullish
Timeframe : Weekly
New HIGH record (1 month)
Type : Bullish
Timeframe : Weekly
Technical
Technical analysis of T-MOBILE US INC. in Daily shows an overall bullish trend. 75.00% of the signals given by moving averages are bullish. Caution: the neutral signals currently given by short-term moving averages show us that the global trend is losing momentum. An assessment of moving averages reveals a bearish signal that could impact this trend:
Bearish price crossover with Moving Average 20
Type : Bearish
Timeframe : Daily
An assessment of technical indicators does not currently provide any relevant information to suggest whether the signal given by the technical indicators is more bullish or bearish.
Caution: the Central Indicators scanner currently detects an excess:
MACD indicator: bearish divergence
Type : Bearish
Timeframe : Daily
RSI indicator: bearish divergence
Type : Bearish
Timeframe : Daily
Pivot points : price is under support 3
Type : Neutral
Timeframe : Daily
Parabolic SAR indicator bullish reversal
Type : Bullish
Timeframe : Daily
Price is back under the pivot point
Type : Bearish
Timeframe : Weekly
Williams %R indicator is back under -50
Type : Bearish
Timeframe : Daily
The Central Patterns scanner, which studies chart patterns, resistances and supports, has identified this signal:
Near support of channel
Type : Bullish
Timeframe : Daily
Central Candlesticks, the scanner specialised in Japanese candlesticks, detects a bearish signal that could support the hypothesis of a small drop in the very short term:
Bearish engulfing lines
Type : Bearish
Timeframe : Daily
| S3 | S2 | S1 | Price | R1 | R2 | R3 | |
|---|---|---|---|---|---|---|---|
| ProTrendLines | 106.71 | 115.03 | 121.60 | 134.47 | 135.06 | 138.59 | 149.41 |
| Change (%) | -20.64% | -14.46% | -9.57% | - | +0.44% | +3.06% | +11.11% |
| Change | -27.76 | -19.44 | -12.87 | - | +0.59 | +4.12 | +14.94 |
| Level | Minor | Minor | Major | - | Major | Major | Major |
Attention could also be paid to pivot points to set price objectives:
| Pivot points | S3 | S2 | S1 | PP | R1 | R2 | R3 |
|---|---|---|---|---|---|---|---|
| Standard | 128.06 | 131.08 | 132.77 | 135.79 | 137.48 | 140.50 | 142.19 |
| Camarilla | 133.18 | 133.61 | 134.04 | 134.47 | 134.90 | 135.33 | 135.77 |
| Woodie | 127.41 | 130.75 | 132.12 | 135.46 | 136.83 | 140.17 | 141.54 |
| Fibonacci | 131.08 | 132.88 | 133.99 | 135.79 | 137.59 | 138.70 | 140.50 |
| Pivot points | S3 | S2 | S1 | PP | R1 | R2 | R3 |
|---|---|---|---|---|---|---|---|
| Standard | 129.12 | 130.80 | 134.08 | 135.76 | 139.04 | 140.72 | 144.00 |
| Camarilla | 136.01 | 136.46 | 136.92 | 137.37 | 137.83 | 138.28 | 138.73 |
| Woodie | 129.93 | 131.20 | 134.89 | 136.16 | 139.85 | 141.12 | 144.81 |
| Fibonacci | 130.80 | 132.69 | 133.86 | 135.76 | 137.65 | 138.82 | 140.72 |
| Pivot points | S3 | S2 | S1 | PP | R1 | R2 | R3 |
|---|---|---|---|---|---|---|---|
| Standard | 107.32 | 114.54 | 124.54 | 131.76 | 141.76 | 148.98 | 158.98 |
| Camarilla | 129.81 | 131.38 | 132.96 | 134.54 | 136.12 | 137.70 | 139.28 |
| Woodie | 108.71 | 115.24 | 125.93 | 132.46 | 143.15 | 149.68 | 160.37 |
| Fibonacci | 114.54 | 121.12 | 125.18 | 131.76 | 138.34 | 142.40 | 148.98 |
Numerical data
The following are the details of the technical indicators and moving averages that were collected to generate this technical analysis:
| RSI (14): | 51.03 | |
| MACD (12,26,9): | 1.1200 | |
| Directional Movement: | 4.39 | |
| AROON (14): | -35.71 | |
| DEMA (21): | 136.20 | |
| Parabolic SAR (0,02-0,02-0,2): | 132.47 | |
| Elder Ray (13): | 1.25 | |
| Super Trend (3,10): | 126.79 | |
| Zig ZAG (10): | 134.47 | |
| VORTEX (21): | 1.0700 | |
| Stochastique (14,3,5): | 53.13 | |
| TEMA (21): | 136.28 | |
| Williams %R (14): | -68.40 | |
| Chande Momentum Oscillator (20): | 0.10 | |
| Repulse (5,40,3): | -1.8100 | |
| ROCnROLL: | -1 | |
| TRIX (15,9): | 0.1400 | |
| Courbe Coppock: | 3.26 |
| MA7: | 135.33 | |
| MA20: | 134.95 | |
| MA50: | 131.57 | |
| MA100: | 129.58 | |
| MAexp7: | 135.49 | |
| MAexp20: | 134.63 | |
| MAexp50: | 132.42 | |
| MAexp100: | 129.87 | |
| Price / MA7: | -0.64% | |
| Price / MA20: | -0.36% | |
| Price / MA50: | +2.20% | |
| Price / MA100: | +3.77% | |
| Price / MAexp7: | -0.75% | |
| Price / MAexp20: | -0.12% | |
| Price / MAexp50: | +1.55% | |
| Price / MAexp100: | +3.54% |
News
The latest news and videos published on T-MOBILE US INC. at the time of the analysis were as follows:
- T-Mobile Dominates in New Report from Ookla
- T-Mobile to Host Q2 2022 Earnings Call on July 27, 2022
- Support in Seconds: T-Mobile Customers Can Now Text 988 to Get Quick, Free Access to Mental Health Services
- Spoke Chooses T IoT from T-Mobile and Deutsche Telekom to Pave the Way for Safer Cycling
- T-Mobile Goes Big for Fans this MLB All-Star Week With More Than $150K in Fan Giveaways, 5G Batting Practice Experience and More
About author

Online


Add a comment
Comments
0 comments on the analysis T-MOBILE US INC. - Daily