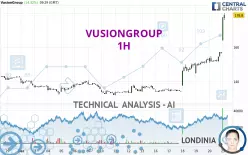
VUSIONGROUP - 1H - Technical analysis published on 12/23/2024 (GMT)
- 113
- 0
Click here for a new analysis!
- Timeframe : 1H
- - Analysis generated on
- Status : LEVEL MAINTAINED

Summary of the analysis

Additional analysis
Quotes
VUSIONGROUP rating 178.8 EUR. The price registered an increase of +14.32% on the session and was traded between 164.0 EUR and 180.0 EUR over the period. The price is currently at +9.02% from its lowest and -0.67% from its highest.The Central Gaps scanner detects a bullish gap which is a sign that buyers have taken the lead in the very short term.
Opening Gap UP
Type : Bullish
Timeframe : Openning
Here is a more detailed summary of the historical variations registered by VUSIONGROUP:
New HIGH record (5 years)
Type : Bullish
Timeframe : Weekly
New HIGH record (1 year)
Type : Bullish
Timeframe : Weekly
New HIGH record (1st january)
Type : Bullish
Timeframe : Weekly
New HIGH record (1 month)
Type : Bullish
Timeframe : Weekly
Technical
Technical analysis of this 1H chart of VUSIONGROUP indicates that the overall trend is strongly bullish. 92.86% of the signals given by moving averages are bullish. The overall trend is supported by the strong bullish signals from short-term moving averages. The Central Indicators scanner does not detect any result on moving averages that would impact this trend.
Technical indicators are strongly bullish, suggesting that the price increase should continue.
But beware of excesses. The Central Indicators scanner currently detects this:
RSI indicator is overbought : over 90
Type : Neutral
Timeframe : 1 hour
CCI indicator is overbought : over 100
Type : Neutral
Timeframe : 1 hour
Previous candle closed over Bollinger bands
Type : Neutral
Timeframe : 1 hour
Williams %R indicator is overbought : over -20
Type : Neutral
Timeframe : 1 hour
Pivot points : price is over resistance 2
Type : Neutral
Timeframe : Weekly
Pivot points : price is over resistance 3
Type : Neutral
Timeframe : 1 hour
An analysis of the price chart with the Central Patterns scanner (detector of chart patterns and resistances and supports) shows a result that can have an impact on the price change:
Near horizontal resistance
Type : Bearish
Timeframe : 1 hour
Central Candlesticks, the scanner specialised in Japanese candlesticks, detects these bearish signals that could support the hypothesis of a small drop in the very short term:
Bearish harami
Type : Bearish
Timeframe : 1 hour
Bearish harami cross
Type : Bearish
Timeframe : 1 hour
| S3 | S2 | S1 | Price | |
|---|---|---|---|---|
| ProTrendLines | 156.2 | 164.3 | 172.0 | 178.8 |
| Change (%) | -12.64% | -8.11% | -3.80% | - |
| Change | -22.6 | -14.5 | -6.8 | - |
| Level | Major | Intermediate | Intermediate | - |
Attention could also be paid to pivot points to set price objectives:
| Pivot points | S3 | S2 | S1 | PP | R1 | R2 | R3 |
|---|---|---|---|---|---|---|---|
| Standard | 145.9 | 148.3 | 152.4 | 154.8 | 158.9 | 161.3 | 165.4 |
| Camarilla | 154.6 | 155.2 | 155.8 | 156.4 | 157.0 | 157.6 | 158.2 |
| Woodie | 146.7 | 148.7 | 153.2 | 155.2 | 159.7 | 161.7 | 166.2 |
| Fibonacci | 148.3 | 150.8 | 152.4 | 154.8 | 157.3 | 158.9 | 161.3 |
| Pivot points | S3 | S2 | S1 | PP | R1 | R2 | R3 |
|---|---|---|---|---|---|---|---|
| Standard | 117.5 | 125.7 | 141.0 | 149.2 | 164.5 | 172.7 | 188.0 |
| Camarilla | 149.9 | 152.1 | 154.3 | 156.4 | 158.6 | 160.7 | 162.9 |
| Woodie | 121.2 | 127.5 | 144.7 | 151.0 | 168.2 | 174.5 | 191.7 |
| Fibonacci | 125.7 | 134.6 | 140.2 | 149.2 | 158.1 | 163.7 | 172.7 |
| Pivot points | S3 | S2 | S1 | PP | R1 | R2 | R3 |
|---|---|---|---|---|---|---|---|
| Standard | 121.4 | 126.5 | 134.6 | 139.7 | 147.8 | 152.9 | 161.0 |
| Camarilla | 139.2 | 140.4 | 141.6 | 142.8 | 144.0 | 145.2 | 146.4 |
| Woodie | 123.0 | 127.3 | 136.2 | 140.5 | 149.4 | 153.7 | 162.6 |
| Fibonacci | 126.5 | 131.5 | 134.6 | 139.7 | 144.7 | 147.8 | 152.9 |
Numerical data
The following are the details of the technical indicators and moving averages that were collected to generate this technical analysis:
| RSI (14): | 90.30 | |
| MACD (12,26,9): | 4.6000 | |
| Directional Movement: | 56.2 | |
| AROON (14): | 85.7 | |
| DEMA (21): | 159.5 | |
| Parabolic SAR (0,02-0,02-0,2): | 151.6 | |
| Elder Ray (13): | 13.3 | |
| Super Trend (3,10): | 159.0 | |
| Zig ZAG (10): | 173.6 | |
| VORTEX (21): | 1.2000 | |
| Stochastique (14,3,5): | 92.40 | |
| TEMA (21): | 160.9 | |
| Williams %R (14): | -5.70 | |
| Chande Momentum Oscillator (20): | 22.5 | |
| Repulse (5,40,3): | 8.0000 | |
| ROCnROLL: | 1 | |
| TRIX (15,9): | 0.4000 | |
| Courbe Coppock: | 9.60 |
| MA7: | 148.4 | |
| MA20: | 141.5 | |
| MA50: | 140.4 | |
| MA100: | 141.6 | |
| MAexp7: | 159.3 | |
| MAexp20: | 153.7 | |
| MAexp50: | 147.2 | |
| MAexp100: | 143.0 | |
| Price / MA7: | +20.49% | |
| Price / MA20: | +26.36% | |
| Price / MA50: | +27.35% | |
| Price / MA100: | +26.27% | |
| Price / MAexp7: | +12.24% | |
| Price / MAexp20: | +16.33% | |
| Price / MAexp50: | +21.47% | |
| Price / MAexp100: | +25.03% |
News
Don't forget to follow the news on VUSIONGROUP. At the time of publication of this analysis, the latest news was as follows:
- VusionGroup to expand digital solutions across all Walmart U.S. Stores
- VusionGroup and The Fresh Market to Revolutionize Retail Experience with Unprecedented Vusion 360 roll-out in the U.S.
- VusionGroup and The Fresh Market® to Revolutionize Retail Experience with Unprecedented Vusion 360 Roll-Out in the U.S.
- Italian grocery retailer Coop Alleanza 3.0 Partners with VusionGroup for Next-Level Store Digitalization
- Darty Accelerates its Store Digitalization with VusionGroup Across 216 Stores in France
About author
Online


Add a comment
Comments
0 comments on the analysis VUSIONGROUP - 1H