| Open: | 197.9 |
| Change: | -1.5 |
| Volume: | 8,578 |
| Low: | 195.1 |
| High: | 198.5 |
| High / Low range: | 3.4 |
| Type: | Stocks |
| Ticker: | VU |
| ISIN: | FR0010282822 |
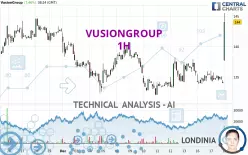
VUSIONGROUP - 1H - Technical analysis published on 12/18/2024 (GMT)
- 94
- 0
- 12/18/2024 - 08:40
- Timeframe : 1H
- - Analysis generated on 12/18/2024 - 08:40
- Status : NEUTRAL

Summary of the analysis

Additional analysis
Quotes
VUSIONGROUP rating 144.0 EUR. The price registered an increase of +7.46% on the session with the lowest point at 137.7 EUR and the highest point at 145.5 EUR. The deviation from the price is +4.58% for the low point and -1.03% for the high point.The Central Gaps scanner detects the formation of a bullish gap marking the strong presence of buyers against sellers at the opening. This formed a quotation gap.
Opening Gap UP
Type : Bullish
Timeframe : Openning
So that you have an overall view of the price change, here is a table showing the variations over several periods:
New HIGH record (1 month)
Type : Bullish
Timeframe : Weekly
Technical
A technical analysis in 1H of this VUSIONGROUP chart shows a neutral trend. This indecision could turn into a bullish trend due to the slightly bullish signals currently given by short-term moving averages. The Central Indicators market scanner is currently detecting several bullish signals that could impact this trend:
Moving Average bullish crossovers : MA20 & MA50
Type : Bullish
Timeframe : 1 hour
Bullish price crossover with Moving Average 20
Type : Bullish
Timeframe : 1 hour
Bullish price crossover with Moving Average 50
Type : Bullish
Timeframe : 1 hour
Bullish price crossover with Moving Average 100
Type : Bullish
Timeframe : 1 hour
Bullish price crossover with adaptative moving average 20
Type : Bullish
Timeframe : 1 hour
Bullish price crossover with adaptative moving average 50
Type : Bullish
Timeframe : 1 hour
Bullish price crossover with adaptative moving average 100
Type : Bullish
Timeframe : 1 hour
In fact, 11 technical indicators on 18 studied are currently bullish. Caution: the Central Indicators scanner currently detects an excess:
RSI indicator is overbought : over 70
Type : Neutral
Timeframe : 1 hour
CCI indicator is overbought : over 100
Type : Neutral
Timeframe : 1 hour
Williams %R indicator is overbought : over -20
Type : Neutral
Timeframe : 1 hour
Pivot points : price is over resistance 1
Type : Neutral
Timeframe : Weekly
Pivot points : price is over resistance 3
Type : Neutral
Timeframe : 1 hour
MACD crosses UP its Moving Average
Type : Bullish
Timeframe : 1 hour
Parabolic SAR indicator bullish reversal
Type : Bullish
Timeframe : 1 hour
Ichimoku : price is over the cloud
Type : Bullish
Timeframe : 1 hour
MACD indicator is back over 0
Type : Bullish
Timeframe : 1 hour
Momentum indicator is back over 0
Type : Bullish
Timeframe : 1 hour
An analysis of the price chart with the Central Patterns scanner (detector of chart patterns and resistances and supports) shows several results that can have an impact on the price change:
Near horizontal support
Type : Bullish
Timeframe : 1 hour
Near support of channel
Type : Bullish
Timeframe : 1 hour
The presence of these bullish Japanese candlestick patterns detected by Central Candlesticks that could cause a very short term rebound were also noted:
White morning star
Type : Bullish
Timeframe : 1 hour
White line without lower shadow
Type : Bullish
Timeframe : 1 hour
Long white line
Type : Bullish
Timeframe : 1 hour
Abandoned baby morning star
Type : Bullish
Timeframe : 1 hour
| S3 | S2 | S1 | Price | R1 | R2 | R3 | |
|---|---|---|---|---|---|---|---|
| ProTrendLines | 138.2 | 140.7 | 143.3 | 144.0 | 144.7 | 156.2 | 164.3 |
| Change (%) | -4.03% | -2.29% | -0.49% | - | +0.49% | +8.47% | +14.10% |
| Change | -5.8 | -3.3 | -0.7 | - | +0.7 | +12.2 | +20.3 |
| Level | Intermediate | Intermediate | Intermediate | - | Minor | Major | Minor |
Attention could also be paid to pivot points to set price objectives:
| Pivot points | S3 | S2 | S1 | PP | R1 | R2 | R3 |
|---|---|---|---|---|---|---|---|
| Standard | 131.3 | 132.7 | 133.3 | 134.7 | 135.3 | 136.7 | 137.3 |
| Camarilla | 133.5 | 133.6 | 133.8 | 134.0 | 134.2 | 134.4 | 134.6 |
| Woodie | 131.0 | 132.5 | 133.0 | 134.5 | 135.0 | 136.5 | 137.0 |
| Fibonacci | 132.7 | 133.4 | 133.9 | 134.7 | 135.4 | 135.9 | 136.7 |
| Pivot points | S3 | S2 | S1 | PP | R1 | R2 | R3 |
|---|---|---|---|---|---|---|---|
| Standard | 123.1 | 127.5 | 131.8 | 136.2 | 140.5 | 144.9 | 149.2 |
| Camarilla | 133.6 | 134.4 | 135.2 | 136.0 | 136.8 | 137.6 | 138.4 |
| Woodie | 123.0 | 127.5 | 131.7 | 136.2 | 140.4 | 144.9 | 149.1 |
| Fibonacci | 127.5 | 130.9 | 132.9 | 136.2 | 139.6 | 141.6 | 144.9 |
| Pivot points | S3 | S2 | S1 | PP | R1 | R2 | R3 |
|---|---|---|---|---|---|---|---|
| Standard | 121.4 | 126.5 | 134.6 | 139.7 | 147.8 | 152.9 | 161.0 |
| Camarilla | 139.2 | 140.4 | 141.6 | 142.8 | 144.0 | 145.2 | 146.4 |
| Woodie | 123.0 | 127.3 | 136.2 | 140.5 | 149.4 | 153.7 | 162.6 |
| Fibonacci | 126.5 | 131.5 | 134.6 | 139.7 | 144.7 | 147.8 | 152.9 |
Numerical data
The following is the status of the technical indicators and moving averages at the time of publication of this technical analysis:
| RSI (14): | 42.50 | |
| MACD (12,26,9): | 0.6000 | |
| Directional Movement: | 47.7 | |
| AROON (14): | 7.1 | |
| DEMA (21): | 136.2 | |
| Parabolic SAR (0,02-0,02-0,2): | 133.8 | |
| Elder Ray (13): | 4.2 | |
| Super Trend (3,10): | 136.0 | |
| Zig ZAG (10): | 144.0 | |
| VORTEX (21): | 0.9000 | |
| Stochastique (14,3,5): | 42.40 | |
| TEMA (21): | 137.0 | |
| Williams %R (14): | -5.40 | |
| Chande Momentum Oscillator (20): | 9.5 | |
| Repulse (5,40,3): | -0.6000 | |
| ROCnROLL: | 1 | |
| TRIX (15,9): | 0.0000 | |
| Courbe Coppock: | 2.30 |
| MA7: | 134.5 | |
| MA20: | 137.7 | |
| MA50: | 139.1 | |
| MA100: | 140.5 | |
| MAexp7: | 134.6 | |
| MAexp20: | 134.9 | |
| MAexp50: | 135.3 | |
| MAexp100: | 136.2 | |
| Price / MA7: | +7.06% | |
| Price / MA20: | +4.58% | |
| Price / MA50: | +3.52% | |
| Price / MA100: | +2.49% | |
| Price / MAexp7: | +6.98% | |
| Price / MAexp20: | +6.75% | |
| Price / MAexp50: | +6.43% | |
| Price / MAexp100: | +5.73% |
News
Don't forget to follow the news on VUSIONGROUP. At the time of publication of this analysis, the latest news was as follows:
- 12/18/2024 - 06:45 VusionGroup and The Fresh Market to Revolutionize Retail Experience with Unprecedented Vusion 360 roll-out in the U.S.
- 12/17/2024 - 18:00 VusionGroup and The Fresh Market® to Revolutionize Retail Experience with Unprecedented Vusion 360 Roll-Out in the U.S.
- 12/11/2024 - 06:45 Italian grocery retailer Coop Alleanza 3.0 Partners with VusionGroup for Next-Level Store Digitalization
- 11/26/2024 - 06:45 Darty Accelerates its Store Digitalization with VusionGroup Across 216 Stores in France
- 10/28/2024 - 16:40 VusionGroup - Q3 2024 Sales: Accelerating growth in the third quarter. Full-year guidance confirmed.
About author
Online


Add a comment
Comments
0 comments on the analysis VUSIONGROUP - 1H