THE GRAPH - GRT/USD overview
THE GRAPH - GRT/USD
> Analyses

 Thank you
Reply
Chart
Thank you
Reply
Chart
Londinia
has published a new analysis.
- 0
- 97739
- 15991
- 0
Timeframe : 1H - Simple chart
Status : TARGET REACHED
The strong short-term decline in THE GRAPH - GRT/USD calls into question the currently slightly bullish basic trend. A trend reversal is likely. As long as the price remains below the resistance…
THE GRAPH - GRT/USD
> Analyses
 Thank you
Reply
Chart
Thank you
Reply
Chart
Londinia
has published a new analysis.
- 0
- 97739
- 15991
- 0
Timeframe : 1H - Simple chart
Status : LEVEL MAINTAINED
THE GRAPH - GRT/USD is part of a very strong bearish trend. Traders may consider trading only short positions (for sale) as long as the price remains well below 0.100034 USD. The next support located…
THE GRAPH - GRT/USD
> Analyses
 Thank you
Reply
Chart
Thank you
Reply
Chart
Londinia
has published a new analysis.
- 0
- 97739
- 15991
- 0
Timeframe : 1H - Simple chart
Status : TARGET REACHED
In the short term, we can see an acceleration in the bearish trend on THE GRAPH - GRT/USD, which is a positive signal for sellers. As long as the price remains above 0.111616 USD, a sale could be…
THE GRAPH - GRT/USD
> Analyses
 Thank you
Reply
Chart
Thank you
Reply
Chart
Londinia
has published a new analysis.
- 0
- 97739
- 15991
- 0
Timeframe : 1H - Simple chart
Status : INVALID
The basic bullish trend is very strong on THE GRAPH - GRT/USD but the short term shows some signs of running out of steam. However, a purchase could be considered as long as the price remains above…
THE GRAPH - GRT/USD
> Analyses
 Thank you
Reply
Chart
Thank you
Reply
Chart
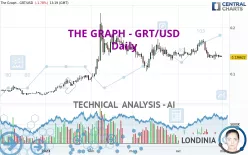
Timeframe : Daily - Simple chart
Status : TARGET REACHED
The strong short-term decrease of THE GRAPH - GRT/USD should quickly allow the basic trend to become bearish. As long as the price remains below the resistance located at 0.147478 USD, a sale could be…
THE GRAPH - GRT/USD
> Analyses
 Thank you
Reply
Chart
Thank you
Reply
Chart
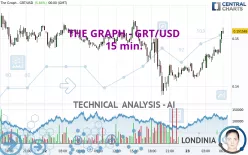
Timeframe : 15 min. - Simple chart
Status : TARGET REACHED
The strong short-term increase for THE GRAPH - GRT/USD reinforces the current slightly bullish trend. As long as the price remains above 0.145169 USD, you could take advantage of this bullish…
THE GRAPH - GRT/USD
> Analyses
 Thank you
Reply
Chart
Thank you
Reply
Chart
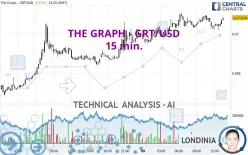
Timeframe : 15 min. - Simple chart
Status : TARGET REACHED
The basic bullish trend is very strong on THE GRAPH - GRT/USD but the short term shows some signs of running out of steam. However, a purchase could be considered as long as the price remains above…
THE GRAPH - GRT/USD
> Analyses
 Thank you
Reply
Chart
Thank you
Reply
Chart
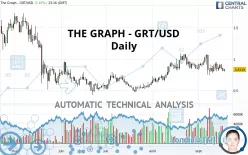
Timeframe : Daily - Simple chart
Status : TARGET REACHED
The short-term decline is currently reinforcing the basic trend, which is only slightly bearish. It would be possible for traders to only trade short positions (for sale) on THE GRAPH - GRT/USD as…

