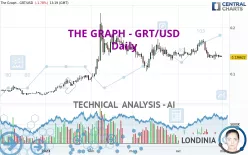
THE GRAPH - GRT/USD - Daily - Technical analysis published on 04/30/2023 (GMT)
- 307
- 0
Click here for a new analysis!
- Timeframe : Daily
- - Analysis generated on
- Status : TARGET REACHED

Summary of the analysis

Additional analysis
Quotes
The THE GRAPH - GRT/USD price is 0.136622 USD. The price registered a decrease of -1.78% on the session and was traded between 0.136209 USD and 0.139099 USD over the period. The price is currently at +0.30% from its lowest and -1.78% from its highest.The Central Gaps scanner detects a bullish opening. A small advantage for buyers in the very short term.
Bullish opening
Type : Bullish
Timeframe : Openning
So that you have an overall view of the price change, here is a table showing the variations over several periods:
Near a new LOW record (1 month)
Type : Bearish
Timeframe : Weekly
Technical
A technical analysis in Daily of this THE GRAPH - GRT/USD chart shows a neutral trend. This indecision could turn into a bearish trend due to the strong bearish signals currently being given by short-term moving averages. The Central Indicators scanner detects bearish signals on moving averages that could impact this trend:
Bearish price crossover with Moving Average 100
Type : Bearish
Timeframe : Daily
Bearish price crossover with adaptative moving average 100
Type : Bearish
Timeframe : Daily
In fact, according to the parameters integrated into the Central Analyzer system, 10 technical indicators out of 18 analysed are currently bearish. Caution: the Central Indicators scanner currently detects an excess:
Williams %R indicator is oversold : under -80
Type : Neutral
Timeframe : Daily
Pivot points : price is under support 1
Type : Neutral
Timeframe : Daily
The analysis of the price chart with Central Patterns scanners does not return any result.
Central Candlesticks, the scanner specialised in Japanese candlesticks, detects a bearish signal that could support the hypothesis of a small drop in the very short term:
Bearish engulfing lines
Type : Bearish
Timeframe : Daily
| S3 | S2 | S1 | Price | R1 | R2 | R3 | |
|---|---|---|---|---|---|---|---|
| ProTrendLines | 0.072289 | 0.114900 | 0.134012 | 0.136622 | 0.147478 | 0.172352 | 0.184921 |
| Change (%) | -47.09% | -15.90% | -1.91% | - | +7.95% | +26.15% | +35.35% |
| Change | -0.064333 | -0.021722 | -0.002610 | - | +0.010856 | +0.035730 | +0.048299 |
| Level | Minor | Intermediate | Major | - | Intermediate | Intermediate | Minor |
Pivot points can also be used to set your price objectives. Here is the price situation in relation to pivot points:
| Pivot points | S3 | S2 | S1 | PP | R1 | R2 | R3 |
|---|---|---|---|---|---|---|---|
| Standard | 0.132197 | 0.134364 | 0.136730 | 0.138897 | 0.141263 | 0.143430 | 0.145796 |
| Camarilla | 0.137850 | 0.138266 | 0.138682 | 0.139097 | 0.139513 | 0.139928 | 0.140344 |
| Woodie | 0.132298 | 0.134414 | 0.136831 | 0.138947 | 0.141364 | 0.143480 | 0.145897 |
| Fibonacci | 0.134364 | 0.136095 | 0.137165 | 0.138897 | 0.140628 | 0.141698 | 0.143430 |
| Pivot points | S3 | S2 | S1 | PP | R1 | R2 | R3 |
|---|---|---|---|---|---|---|---|
| Standard | 0.111680 | 0.120976 | 0.130036 | 0.139332 | 0.148392 | 0.157688 | 0.166748 |
| Camarilla | 0.134049 | 0.135732 | 0.137414 | 0.139097 | 0.140780 | 0.142462 | 0.144145 |
| Woodie | 0.111563 | 0.120917 | 0.129919 | 0.139273 | 0.148275 | 0.157629 | 0.166631 |
| Fibonacci | 0.120976 | 0.127988 | 0.132320 | 0.139332 | 0.146344 | 0.150676 | 0.157688 |
| Pivot points | S3 | S2 | S1 | PP | R1 | R2 | R3 |
|---|---|---|---|---|---|---|---|
| Standard | 0.049702 | 0.080814 | 0.113157 | 0.144269 | 0.176612 | 0.207724 | 0.240067 |
| Camarilla | 0.128049 | 0.133866 | 0.139682 | 0.145499 | 0.151316 | 0.157132 | 0.162949 |
| Woodie | 0.050317 | 0.081122 | 0.113772 | 0.144577 | 0.177227 | 0.208032 | 0.240682 |
| Fibonacci | 0.080814 | 0.105054 | 0.120030 | 0.144269 | 0.168509 | 0.183485 | 0.207724 |
Numerical data
The following is the status of technical indicators and moving averages registered at the time this technical analysis was created:
| RSI (14): | 43.12 | |
| MACD (12,26,9): | -0.0030 | |
| Directional Movement: | -2.366920 | |
| AROON (14): | -50.000000 | |
| DEMA (21): | 0.141039 | |
| Parabolic SAR (0,02-0,02-0,2): | 0.160013 | |
| Elder Ray (13): | -0.004514 | |
| Super Trend (3,10): | 0.165271 | |
| Zig ZAG (10): | 0.136933 | |
| VORTEX (21): | 0.9864 | |
| Stochastique (14,3,5): | 16.27 | |
| TEMA (21): | 0.137373 | |
| Williams %R (14): | -85.28 | |
| Chande Momentum Oscillator (20): | -0.032911 | |
| Repulse (5,40,3): | -2.1405 | |
| ROCnROLL: | 2 | |
| TRIX (15,9): | -0.1094 | |
| Courbe Coppock: | 25.33 |
| MA7: | 0.138484 | |
| MA20: | 0.148385 | |
| MA50: | 0.146608 | |
| MA100: | 0.141103 | |
| MAexp7: | 0.139338 | |
| MAexp20: | 0.144003 | |
| MAexp50: | 0.144076 | |
| MAexp100: | 0.135078 | |
| Price / MA7: | -1.34% | |
| Price / MA20: | -7.93% | |
| Price / MA50: | -6.81% | |
| Price / MA100: | -3.18% | |
| Price / MAexp7: | -1.95% | |
| Price / MAexp20: | -5.13% | |
| Price / MAexp50: | -5.17% | |
| Price / MAexp100: | +1.14% |
About author

Online


Add a comment
Comments
0 comments on the analysis THE GRAPH - GRT/USD - Daily