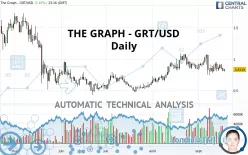
THE GRAPH - GRT/USD - Daily - Technical analysis published on 09/18/2021 (GMT)
- 323
- 0
Click here for a new analysis!
- Timeframe : Daily
- - Analysis generated on
- Status : TARGET REACHED

Summary of the analysis

Additional analysis
Quotes
The THE GRAPH - GRT/USD rating is 0.833900 USD. The price registered an increase of +1.87% on the session and was between 0.803400 USD and 0.847800 USD. This implies that the price is at +3.80% from its lowest and at -1.64% from its highest.The Central Gaps scanner detects a bearish opening marking the presence of sellers ahead of buyers at the opening but not sufficiently marked to allow the price to register a quotation gap.
Bearish opening
Type : Bearish
Timeframe : Openning
A study of price movements over other periods shows the following variations:
Technical
Technical analysis of this Daily chart of THE GRAPH - GRT/USD indicates that the overall trend is slightly bearish. Only 53.57% of the signals given by moving averages are bearish. This slightly bearish trend is reinforced by the strong signals currently being given by short-term moving averages. The Central Indicators scanner detects bearish signals on moving averages that could impact this trend:
Bearish trend reversal : adaptative moving average 50
Type : Bearish
Timeframe : Daily
Bearish trend reversal : adaptative moving average 100
Type : Bearish
Timeframe : Daily
Bearish price crossover with Moving Average 50
Type : Bearish
Timeframe : Daily
Bearish price crossover with adaptative moving average 50
Type : Bearish
Timeframe : Daily
An assessment of technical indicators does not currently provide any relevant information to suggest whether the signal given by the technical indicators is more bullish or bearish.
Caution: the Central Indicators scanner currently detects an excess:
CCI indicator is oversold : under -100
Type : Neutral
Timeframe : Daily
Price is back under the pivot point
Type : Bearish
Timeframe : Daily
Price is back under the pivot point
Type : Bearish
Timeframe : Weekly
Central Patterns, the market scanner focusing on chart patterns, resistances and supports found this result:
Horizontal resistance is broken
Type : Bullish
Timeframe : Daily
The Central Candlesticks scanner, specialised in Japanese candlesticks, did not identify any signals.
| S2 | S1 | Price | R1 | R2 | R3 | |
|---|---|---|---|---|---|---|
| ProTrendLines | 0.492800 | 0.727882 | 0.833900 | 0.854900 | 1.069500 | 1.340000 |
| Change (%) | -40.90% | -12.71% | - | +2.52% | +28.25% | +60.69% |
| Change | -0.341100 | -0.106018 | - | +0.021000 | +0.235600 | +0.506100 |
| Level | Intermediate | Intermediate | - | Minor | Intermediate | Minor |
Attention could also be paid to pivot points to set price objectives:
| Pivot points | S3 | S2 | S1 | PP | R1 | R2 | R3 |
|---|---|---|---|---|---|---|---|
| Standard | 0.737233 | 0.772067 | 0.795333 | 0.830167 | 0.853433 | 0.888267 | 0.911533 |
| Camarilla | 0.802623 | 0.807948 | 0.813274 | 0.818600 | 0.823926 | 0.829252 | 0.834578 |
| Woodie | 0.731450 | 0.769175 | 0.789550 | 0.827275 | 0.847650 | 0.885375 | 0.905750 |
| Fibonacci | 0.772067 | 0.794261 | 0.807973 | 0.830167 | 0.852361 | 0.866073 | 0.888267 |
| Pivot points | S3 | S2 | S1 | PP | R1 | R2 | R3 |
|---|---|---|---|---|---|---|---|
| Standard | 0.394267 | 0.570833 | 0.722867 | 0.899433 | 1.051467 | 1.228033 | 1.380067 |
| Camarilla | 0.784535 | 0.814657 | 0.844778 | 0.874900 | 0.905022 | 0.935143 | 0.965265 |
| Woodie | 0.382000 | 0.564700 | 0.710600 | 0.893300 | 1.039200 | 1.221900 | 1.367800 |
| Fibonacci | 0.570833 | 0.696359 | 0.773908 | 0.899433 | 1.024959 | 1.102508 | 1.228033 |
| Pivot points | S3 | S2 | S1 | PP | R1 | R2 | R3 |
|---|---|---|---|---|---|---|---|
| Standard | 0.145233 | 0.381767 | 0.617933 | 0.854467 | 1.090633 | 1.327167 | 1.563333 |
| Camarilla | 0.724108 | 0.767438 | 0.810769 | 0.854100 | 0.897431 | 0.940762 | 0.984093 |
| Woodie | 0.145050 | 0.381675 | 0.617750 | 0.854375 | 1.090450 | 1.327075 | 1.563150 |
| Fibonacci | 0.381767 | 0.562338 | 0.673895 | 0.854467 | 1.035038 | 1.146595 | 1.327167 |
Numerical data
The following is the status of technical indicators and moving averages registered at the time this technical analysis was created:
| RSI (14): | 46.77 | |
| MACD (12,26,9): | -0.0077 | |
| Directional Movement: | 1.865519 | |
| AROON (14): | -14.285714 | |
| DEMA (21): | 0.872753 | |
| Parabolic SAR (0,02-0,02-0,2): | 0.967349 | |
| Elder Ray (13): | -0.041734 | |
| Super Trend (3,10): | 0.759453 | |
| Zig ZAG (10): | 0.831200 | |
| VORTEX (21): | 0.9549 | |
| Stochastique (14,3,5): | 26.65 | |
| TEMA (21): | 0.836474 | |
| Williams %R (14): | -74.86 | |
| Chande Momentum Oscillator (20): | -0.235000 | |
| Repulse (5,40,3): | -3.8893 | |
| ROCnROLL: | 2 | |
| TRIX (15,9): | 0.0472 | |
| Courbe Coppock: | 13.81 |
| MA7: | 0.862614 | |
| MA20: | 0.885755 | |
| MA50: | 0.857188 | |
| MA100: | 0.732301 | |
| MAexp7: | 0.853468 | |
| MAexp20: | 0.874633 | |
| MAexp50: | 0.847988 | |
| MAexp100: | 0.852888 | |
| Price / MA7: | -3.33% | |
| Price / MA20: | -5.85% | |
| Price / MA50: | -2.72% | |
| Price / MA100: | +13.87% | |
| Price / MAexp7: | -2.29% | |
| Price / MAexp20: | -4.66% | |
| Price / MAexp50: | -1.66% | |
| Price / MAexp100: | -2.23% |
About author

Online


Add a comment
Comments
0 comments on the analysis THE GRAPH - GRT/USD - Daily