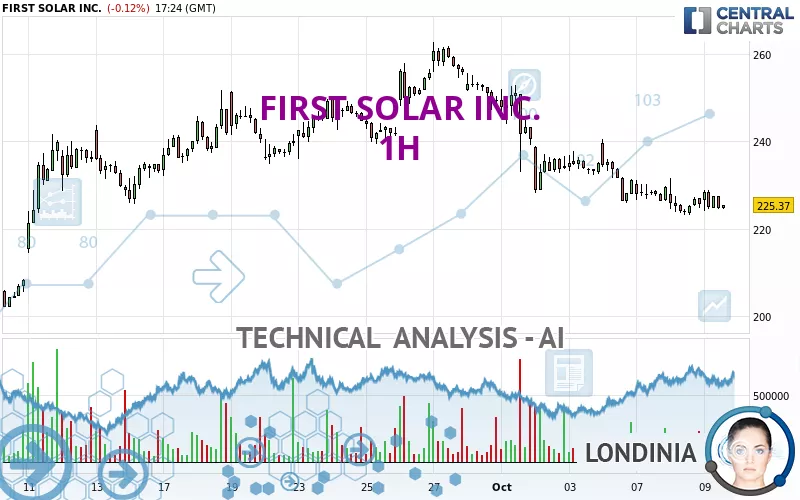
FIRST SOLAR INC. - 1H - Technical analysis published on 10/09/2024 (GMT)
- 168
- 0
Click here for a new analysis!
- Timeframe : 1H
- - Analysis generated on
- Status : TARGET REACHED

Summary of the analysis

Additional analysis
Quotes
FIRST SOLAR INC. rating 225.37 USD. The price registered a decrease of -0.12% on the session with the lowest point at 224.15 USD and the highest point at 228.99 USD. The deviation from the price is +0.54% for the low point and -1.58% for the high point.A bullish opening was detected by the Central Gaps scanner. Buyers are trying to impose a bullish momentum in the very short term.
Bullish opening
Type : Bullish
Timeframe : Openning
A study of price movements over other periods shows the following variations:
Near a new LOW record (1 month)
Type : Bearish
Timeframe : Weekly
Technical
Technical analysis of this 1H chart of FIRST SOLAR INC. indicates that the overall trend is strongly bearish. The signals given by moving averages are 92.86% bearish. This strong bearish trend is confirmed by the strong signals currently being given by short-term moving averages. There is no crossing of moving average by the price or crossing of moving averages between themselves.
In fact, Central Analyzer took into account 18 technical indicators and the result was as follows: 6 are bullish, 5 are neutral and 7 are bearish. But beware of excesses. The Central Indicators scanner currently detects this:
CCI indicator is oversold : under -100
Type : Neutral
Timeframe : 1 hour
Williams %R indicator is oversold : under -80
Type : Neutral
Timeframe : 1 hour
Central Patterns, the market scanner focusing on chart patterns, resistances and supports found these results:
Near horizontal resistance
Type : Bearish
Timeframe : 1 hour
Near resistance of channel
Type : Bearish
Timeframe : 1 hour
For a small rebound in the very short term, the Central Candlesticks scanner currently notes the presence of this bullish pattern in Japanese candlesticks:
Bullish harami cross
Type : Bullish
Timeframe : 1 hour
| S3 | S2 | S1 | Price | R1 | R2 | R3 | |
|---|---|---|---|---|---|---|---|
| ProTrendLines | 202.15 | 211.43 | 217.73 | 225.37 | 225.93 | 231.69 | 240.70 |
| Change (%) | -10.30% | -6.19% | -3.39% | - | +0.25% | +2.80% | +6.80% |
| Change | -23.22 | -13.94 | -7.64 | - | +0.56 | +6.32 | +15.33 |
| Level | Intermediate | Major | Minor | - | Intermediate | Major | Minor |
Attention could also be paid to pivot points to set price objectives:
| Pivot points | S3 | S2 | S1 | PP | R1 | R2 | R3 |
|---|---|---|---|---|---|---|---|
| Standard | 213.58 | 218.37 | 222.01 | 226.80 | 230.44 | 235.23 | 238.87 |
| Camarilla | 223.32 | 224.10 | 224.87 | 225.64 | 226.41 | 227.19 | 227.96 |
| Woodie | 213.00 | 218.08 | 221.43 | 226.51 | 229.86 | 234.94 | 238.29 |
| Fibonacci | 218.37 | 221.59 | 223.58 | 226.80 | 230.02 | 232.01 | 235.23 |
| Pivot points | S3 | S2 | S1 | PP | R1 | R2 | R3 |
|---|---|---|---|---|---|---|---|
| Standard | 189.95 | 207.98 | 219.56 | 237.59 | 249.17 | 267.20 | 278.78 |
| Camarilla | 222.99 | 225.70 | 228.42 | 231.13 | 233.84 | 236.56 | 239.27 |
| Woodie | 186.72 | 206.37 | 216.33 | 235.98 | 245.94 | 265.59 | 275.55 |
| Fibonacci | 207.98 | 219.29 | 226.28 | 237.59 | 248.90 | 255.89 | 267.20 |
| Pivot points | S3 | S2 | S1 | PP | R1 | R2 | R3 |
|---|---|---|---|---|---|---|---|
| Standard | 152.92 | 177.53 | 213.49 | 238.10 | 274.06 | 298.67 | 334.63 |
| Camarilla | 232.78 | 238.34 | 243.89 | 249.44 | 254.99 | 260.55 | 266.10 |
| Woodie | 158.59 | 180.37 | 219.16 | 240.94 | 279.73 | 301.51 | 340.30 |
| Fibonacci | 177.53 | 200.67 | 214.97 | 238.10 | 261.24 | 275.54 | 298.67 |
Numerical data
The following is the status of technical indicators and moving averages registered at the time this technical analysis was created:
| RSI (14): | 41.98 | |
| MACD (12,26,9): | -2.2700 | |
| Directional Movement: | -1.71 | |
| AROON (14): | -21.43 | |
| DEMA (21): | 223.99 | |
| Parabolic SAR (0,02-0,02-0,2): | 223.62 | |
| Elder Ray (13): | -1.65 | |
| Super Trend (3,10): | 233.27 | |
| Zig ZAG (10): | 224.71 | |
| VORTEX (21): | 0.9700 | |
| Stochastique (14,3,5): | 30.49 | |
| TEMA (21): | 224.82 | |
| Williams %R (14): | -79.83 | |
| Chande Momentum Oscillator (20): | -4.80 | |
| Repulse (5,40,3): | -0.6100 | |
| ROCnROLL: | 2 | |
| TRIX (15,9): | -0.1700 | |
| Courbe Coppock: | 2.07 |
| MA7: | 231.65 | |
| MA20: | 238.92 | |
| MA50: | 227.61 | |
| MA100: | 236.00 | |
| MAexp7: | 225.76 | |
| MAexp20: | 227.35 | |
| MAexp50: | 232.41 | |
| MAexp100: | 235.37 | |
| Price / MA7: | -2.71% | |
| Price / MA20: | -5.67% | |
| Price / MA50: | -0.98% | |
| Price / MA100: | -4.50% | |
| Price / MAexp7: | -0.17% | |
| Price / MAexp20: | -0.87% | |
| Price / MAexp50: | -3.03% | |
| Price / MAexp100: | -4.25% |
News
The latest news and videos published on FIRST SOLAR INC. at the time of the analysis were as follows:
- SolarBank's First Solar Project Under Development for Fiera Real Estate Nears Completion
-
 Could the world’s first solar power truck be the answer to decarbonising haulage?
- TotalEnergies ENEOS signs first solar rooftop project of Kinpo Group in the Philippines
- Thinking about trading options or stock in Tesla, Adobe, Meta Platforms, First Solar, or Davita?
- Thinking about trading options or stock in Microsoft, Macy's, Anheuser-Busch Inbev, Docusign, or First Solar?
About author
Online


Add a comment
Comments
0 comments on the analysis FIRST SOLAR INC. - 1H