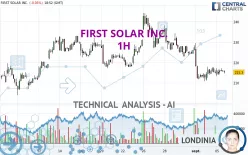
FIRST SOLAR INC. - 1H - Technical analysis published on 09/05/2024 (GMT)
- 166
- 0
Click here for a new analysis!
- Timeframe : 1H
- - Analysis generated on
- Status : TARGET REACHED

Summary of the analysis

Additional analysis
Quotes
The FIRST SOLAR INC. price is 215.30 USD. The price registered a decrease of -0.05% on the session with the lowest point at 213.26 USD and the highest point at 217.22 USD. The deviation from the price is +0.96% for the low point and -0.88% for the high point.So that you have an overall view of the price change, here is a table showing the variations over several periods:
Technical
Technical analysis of this 1H chart of FIRST SOLAR INC. indicates that the overall trend is strongly bearish. 85.71% of the signals given by moving averages are bearish. The slightly bearish signals from short-term moving averages show that the overall trend is slowing down. The Central Indicators scanner detects a bearish signal on moving averages that could impact this trend:
Bearish price crossover with Moving Average 20
Type : Bearish
Timeframe : 1 hour
The probability of a further increase is slight given the direction of the technical indicators.
Central Indicators, the detector scanner for these technical indicators has recently detected several signals:
Pivot points : price is under support 1
Type : Neutral
Timeframe : Weekly
Price is back under the pivot point
Type : Bearish
Timeframe : 1 hour
An analysis of the price chart with the Central Patterns scanner (detector of chart patterns and resistances and supports) shows several results that can have an impact on the price change:
Near horizontal resistance
Type : Bearish
Timeframe : 1 hour
Near support of triangle
Type : Bullish
Timeframe : 1 hour
The Central Candlesticks scanner currently notes the presence of this pattern in Japanese candlesticks that could mark the end of the short-term trend currently underway:
Black hanging man / hammer
Type : Neutral
Timeframe : 1 hour
| S3 | S2 | S1 | Price | R1 | R2 | R3 | |
|---|---|---|---|---|---|---|---|
| ProTrendLines | 195.57 | 204.00 | 211.43 | 215.30 | 217.36 | 224.63 | 231.69 |
| Change (%) | -9.16% | -5.25% | -1.80% | - | +0.96% | +4.33% | +7.61% |
| Change | -19.73 | -11.30 | -3.87 | - | +2.06 | +9.33 | +16.39 |
| Level | Intermediate | Minor | Major | - | Intermediate | Minor | Major |
To determine price objectives, it is also possible to use the pivot points. Here is the price position in relation to pivot points:
| Pivot points | S3 | S2 | S1 | PP | R1 | R2 | R3 |
|---|---|---|---|---|---|---|---|
| Standard | 204.79 | 207.95 | 211.67 | 214.83 | 218.55 | 221.71 | 225.43 |
| Camarilla | 213.51 | 214.14 | 214.77 | 215.40 | 216.03 | 216.66 | 217.29 |
| Woodie | 205.08 | 208.09 | 211.96 | 214.97 | 218.84 | 221.85 | 225.72 |
| Fibonacci | 207.95 | 210.58 | 212.20 | 214.83 | 217.46 | 219.08 | 221.71 |
| Pivot points | S3 | S2 | S1 | PP | R1 | R2 | R3 |
|---|---|---|---|---|---|---|---|
| Standard | 197.02 | 209.82 | 218.60 | 231.40 | 240.18 | 252.98 | 261.76 |
| Camarilla | 221.44 | 223.41 | 225.39 | 227.37 | 229.35 | 231.33 | 233.31 |
| Woodie | 195.00 | 208.82 | 216.58 | 230.40 | 238.16 | 251.98 | 259.74 |
| Fibonacci | 209.82 | 218.07 | 223.16 | 231.40 | 239.65 | 244.74 | 252.98 |
| Pivot points | S3 | S2 | S1 | PP | R1 | R2 | R3 |
|---|---|---|---|---|---|---|---|
| Standard | 151.92 | 173.74 | 200.56 | 222.38 | 249.20 | 271.02 | 297.84 |
| Camarilla | 213.99 | 218.45 | 222.91 | 227.37 | 231.83 | 236.29 | 240.75 |
| Woodie | 154.41 | 174.99 | 203.05 | 223.63 | 251.69 | 272.27 | 300.33 |
| Fibonacci | 173.74 | 192.32 | 203.80 | 222.38 | 240.96 | 252.44 | 271.02 |
Numerical data
The following are the details of the technical indicators and moving averages that were collected to generate this technical analysis:
| RSI (14): | 42.50 | |
| MACD (12,26,9): | -2.0400 | |
| Directional Movement: | -7.18 | |
| AROON (14): | 14.29 | |
| DEMA (21): | 213.83 | |
| Parabolic SAR (0,02-0,02-0,2): | 211.14 | |
| Elder Ray (13): | -0.37 | |
| Super Trend (3,10): | 222.55 | |
| Zig ZAG (10): | 215.15 | |
| VORTEX (21): | 0.8600 | |
| Stochastique (14,3,5): | 69.81 | |
| TEMA (21): | 214.10 | |
| Williams %R (14): | -41.75 | |
| Chande Momentum Oscillator (20): | 0.61 | |
| Repulse (5,40,3): | -0.3800 | |
| ROCnROLL: | 2 | |
| TRIX (15,9): | -0.1800 | |
| Courbe Coppock: | 0.37 |
| MA7: | 222.47 | |
| MA20: | 223.34 | |
| MA50: | 222.32 | |
| MA100: | 223.58 | |
| MAexp7: | 215.50 | |
| MAexp20: | 216.92 | |
| MAexp50: | 220.75 | |
| MAexp100: | 222.38 | |
| Price / MA7: | -3.22% | |
| Price / MA20: | -3.60% | |
| Price / MA50: | -3.16% | |
| Price / MA100: | -3.70% | |
| Price / MAexp7: | -0.09% | |
| Price / MAexp20: | -0.75% | |
| Price / MAexp50: | -2.47% | |
| Price / MAexp100: | -3.18% |
News
Don't forget to follow the news on FIRST SOLAR INC.. At the time of publication of this analysis, the latest news was as follows:
-
 Could the world’s first solar power truck be the answer to decarbonising haulage?
- TotalEnergies ENEOS signs first solar rooftop project of Kinpo Group in the Philippines
- Thinking about trading options or stock in Tesla, Adobe, Meta Platforms, First Solar, or Davita?
- Thinking about trading options or stock in Microsoft, Macy's, Anheuser-Busch Inbev, Docusign, or First Solar?
- UbiQD Expands Collaboration with First Solar on Quantum Dot-Enhanced Solar Modules
About author
Online


Add a comment
Comments
0 comments on the analysis FIRST SOLAR INC. - 1H