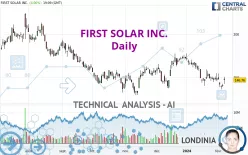
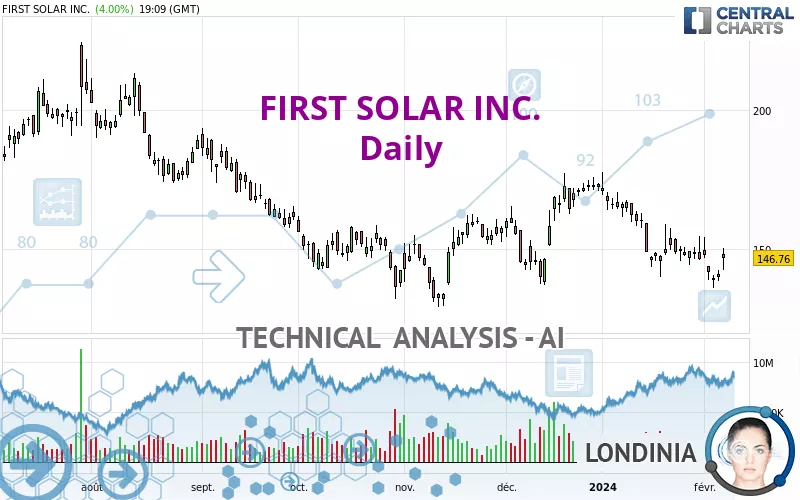
FIRST SOLAR INC. - Daily - Technical analysis published on 02/07/2024 (GMT)
- 233
- 0
Click here for a new analysis!
- Timeframe : Daily
- - Analysis generated on
- Status : INVALID
Summary of the analysis

Additional analysis
Quotes
FIRST SOLAR INC. rating 146.76 USD. The price registered an increase of +4.00% on the session and was between 142.56 USD and 150.27 USD. This implies that the price is at +2.95% from its lowest and at -2.34% from its highest.A bullish gap was detected at the opening by the Central Gaps scanner. There are a lot of buyers and they have the upper hand in the very short term.
Opening Gap UP
Type : Bullish
Timeframe : Openning
Here is a more detailed summary of the historical variations registered by FIRST SOLAR INC.:
Near a new LOW record (1st january)
Type : Bearish
Timeframe : Weekly
Near a new LOW record (1 month)
Type : Bearish
Timeframe : Weekly
Technical
Technical analysis of FIRST SOLAR INC. in Daily shows a overall strongly bearish trend. 89.29% of the signals given by moving averages are bearish. The overall trend is supported by the strong bearish signals from short-term moving averages. An assessment of moving averages reveals a bullish signal that could impact this trend:
Bullish price crossover with adaptative moving average 20
Type : Bullish
Timeframe : Daily
On the 18 technical indicators analysed, 5 are bullish, 6 are neutral and 7 are bearish. Central Indicators, the detector scanner for these technical indicators has recently detected several signals:
Pivot points : price is over resistance 3
Type : Neutral
Timeframe : Daily
Price is back over the pivot point
Type : Bullish
Timeframe : Weekly
The Central Patterns scanner, which studies chart patterns, resistances and supports, has identified these signals:
Near horizontal support
Type : Bullish
Timeframe : Daily
Near support of channel
Type : Bullish
Timeframe : Daily
Near support of triangle
Type : Bullish
Timeframe : Daily
No result was found by the Central Candlesticks scanner on Japanese candlesticks.
| S3 | S2 | S1 | Price | R1 | R2 | R3 | |
|---|---|---|---|---|---|---|---|
| ProTrendLines | 102.70 | 132.53 | 145.46 | 146.76 | 170.80 | 211.43 | 231.69 |
| Change (%) | -30.02% | -9.70% | -0.89% | - | +16.38% | +44.07% | +57.87% |
| Change | -44.06 | -14.23 | -1.30 | - | +24.04 | +64.67 | +84.93 |
| Level | Major | Major | Major | - | Major | Major | Major |
To determine price objectives, it is also possible to use the pivot points. Here is the price position in relation to pivot points:
| Pivot points | S3 | S2 | S1 | PP | R1 | R2 | R3 |
|---|---|---|---|---|---|---|---|
| Standard | 134.84 | 136.62 | 138.87 | 140.65 | 142.90 | 144.68 | 146.93 |
| Camarilla | 140.00 | 140.37 | 140.74 | 141.11 | 141.48 | 141.85 | 142.22 |
| Woodie | 135.07 | 136.74 | 139.10 | 140.77 | 143.13 | 144.80 | 147.16 |
| Fibonacci | 136.62 | 138.16 | 139.11 | 140.65 | 142.19 | 143.14 | 144.68 |
| Pivot points | S3 | S2 | S1 | PP | R1 | R2 | R3 |
|---|---|---|---|---|---|---|---|
| Standard | 119.38 | 129.11 | 135.46 | 145.19 | 151.54 | 161.27 | 167.62 |
| Camarilla | 137.40 | 138.87 | 140.35 | 141.82 | 143.29 | 144.77 | 146.24 |
| Woodie | 117.70 | 128.27 | 133.78 | 144.35 | 149.86 | 160.43 | 165.94 |
| Fibonacci | 129.11 | 135.25 | 139.04 | 145.19 | 151.33 | 155.12 | 161.27 |
| Pivot points | S3 | S2 | S1 | PP | R1 | R2 | R3 |
|---|---|---|---|---|---|---|---|
| Standard | 93.80 | 116.93 | 131.62 | 154.75 | 169.44 | 192.57 | 207.26 |
| Camarilla | 135.90 | 139.37 | 142.83 | 146.30 | 149.77 | 153.23 | 156.70 |
| Woodie | 89.57 | 114.82 | 127.39 | 152.64 | 165.21 | 190.46 | 203.03 |
| Fibonacci | 116.93 | 131.38 | 140.31 | 154.75 | 169.20 | 178.13 | 192.57 |
Numerical data
The following is the status of the technical indicators and moving averages at the time of publication of this technical analysis:
| RSI (14): | 43.77 | |
| MACD (12,26,9): | -4.2700 | |
| Directional Movement: | -0.62 | |
| AROON (14): | -71.42 | |
| DEMA (21): | 144.09 | |
| Parabolic SAR (0,02-0,02-0,2): | 153.12 | |
| Elder Ray (13): | -0.56 | |
| Super Trend (3,10): | 158.50 | |
| Zig ZAG (10): | 147.03 | |
| VORTEX (21): | 0.8400 | |
| Stochastique (14,3,5): | 29.48 | |
| TEMA (21): | 141.08 | |
| Williams %R (14): | -52.29 | |
| Chande Momentum Oscillator (20): | -2.94 | |
| Repulse (5,40,3): | 0.1000 | |
| ROCnROLL: | -1 | |
| TRIX (15,9): | -0.3700 | |
| Courbe Coppock: | 10.99 |
| MA7: | 144.66 | |
| MA20: | 149.11 | |
| MA50: | 156.28 | |
| MA100: | 154.39 | |
| MAexp7: | 144.75 | |
| MAexp20: | 149.33 | |
| MAexp50: | 153.89 | |
| MAexp100: | 159.07 | |
| Price / MA7: | +1.45% | |
| Price / MA20: | -1.58% | |
| Price / MA50: | -6.09% | |
| Price / MA100: | -4.94% | |
| Price / MAexp7: | +1.39% | |
| Price / MAexp20: | -1.72% | |
| Price / MAexp50: | -4.63% | |
| Price / MAexp100: | -7.74% |
News
The last news published on FIRST SOLAR INC. at the time of the generation of this analysis was as follows:
-
 Could the world’s first solar power truck be the answer to decarbonising haulage?
- TotalEnergies ENEOS signs first solar rooftop project of Kinpo Group in the Philippines
- Thinking about trading options or stock in Tesla, Adobe, Meta Platforms, First Solar, or Davita?
- Thinking about trading options or stock in Microsoft, Macy's, Anheuser-Busch Inbev, Docusign, or First Solar?
- UbiQD Expands Collaboration with First Solar on Quantum Dot-Enhanced Solar Modules
About author
Online


Add a comment
Comments
0 comments on the analysis FIRST SOLAR INC. - Daily