FIRST SOLAR INC. - Daily - Technical analysis published on 12/14/2023 (GMT)
- 310
- 0
Click here for a new analysis!
- Timeframe : Daily
- - Analysis generated on
- Status : TARGET REACHED
Summary of the analysis

Additional analysis
Quotes
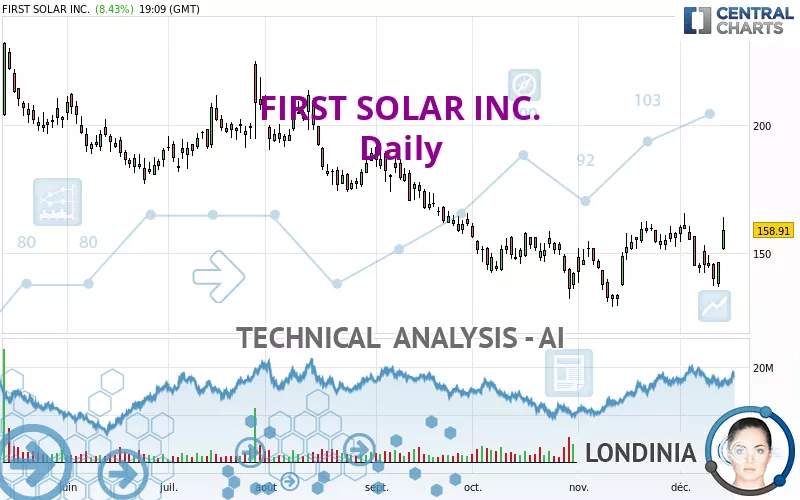
The FIRST SOLAR INC. price is 158.91 USD. On the day, this instrument gained +8.43% and was traded between 151.32 USD and 164.16 USD over the period. The price is currently at +5.02% from its lowest and -3.20% from its highest.A bullish gap was detected at the opening by the Central Gaps scanner. There are a lot of buyers and they have the upper hand in the very short term.
Opening Gap UP
Type : Bullish
Timeframe : Openning
So that you have an overall view of the price change, here is a table showing the variations over several periods:
Near a new HIGH record (1 month)
Type : Bullish
Timeframe : Weekly
Technical
Technical analysis of this Daily chart of FIRST SOLAR INC. indicates that the overall trend is not clearly defined. This indecision could turn into a bullish trend due to the strong bullish signals currently being given by short-term moving averages. The Central Indicators scanner detects bullish signals on moving averages that could impact this trend:
Bullish price crossover with Moving Average 20
Type : Bullish
Timeframe : Daily
Bullish price crossover with Moving Average 50
Type : Bullish
Timeframe : Daily
Bullish price crossover with adaptative moving average 20
Type : Bullish
Timeframe : Daily
Bullish price crossover with adaptative moving average 50
Type : Bullish
Timeframe : Daily
In fact, 12 technical indicators on 18 studied are currently positioned bullish. Central Indicators, the scanner specialised in technical indicators, has identified these signals:
Pivot points : price is over resistance 2
Type : Neutral
Timeframe : Daily
RSI indicator is back over 50
Type : Bullish
Timeframe : Daily
Parabolic SAR indicator bullish reversal
Type : Bullish
Timeframe : Daily
Price is back over the pivot point
Type : Bullish
Timeframe : Weekly
Momentum indicator is back over 0
Type : Bullish
Timeframe : Daily
Williams %R indicator is back over -50
Type : Bullish
Timeframe : Daily
Central Patterns, the market scanner focusing on chart patterns, resistances and supports found this result:
Near horizontal resistance
Type : Bearish
Timeframe : Daily
Central Candlesticks, the scanner specialised in Japanese candlesticks, detects a bullish signal that could support the hypothesis of a small rebound in the very short term:
Upside gap
Type : Bullish
Timeframe : Daily
| S3 | S2 | S1 | Price | R1 | R2 | R3 | |
|---|---|---|---|---|---|---|---|
| ProTrendLines | 73.04 | 102.70 | 132.53 | 158.91 | 160.23 | 170.80 | 178.55 |
| Change (%) | -54.04% | -35.37% | -16.60% | - | +0.83% | +7.48% | +12.36% |
| Change | -85.87 | -56.21 | -26.38 | - | +1.32 | +11.89 | +19.64 |
| Level | Major | Major | Major | - | Intermediate | Intermediate | Minor |
Pivot points can also be used to set your price objectives. Here is the price situation in relation to pivot points:
| Pivot points | S3 | S2 | S1 | PP | R1 | R2 | R3 |
|---|---|---|---|---|---|---|---|
| Standard | 130.63 | 133.90 | 140.23 | 143.50 | 149.83 | 153.10 | 159.43 |
| Camarilla | 143.92 | 144.80 | 145.68 | 146.56 | 147.44 | 148.32 | 149.20 |
| Woodie | 132.16 | 134.67 | 141.76 | 144.27 | 151.36 | 153.87 | 160.96 |
| Fibonacci | 133.90 | 137.57 | 139.83 | 143.50 | 147.17 | 149.43 | 153.10 |
| Pivot points | S3 | S2 | S1 | PP | R1 | R2 | R3 |
|---|---|---|---|---|---|---|---|
| Standard | 113.44 | 127.96 | 136.67 | 151.19 | 159.90 | 174.42 | 183.13 |
| Camarilla | 138.99 | 141.12 | 143.25 | 145.38 | 147.51 | 149.64 | 151.77 |
| Woodie | 110.54 | 126.51 | 133.77 | 149.74 | 157.00 | 172.97 | 180.23 |
| Fibonacci | 127.96 | 136.83 | 142.32 | 151.19 | 160.06 | 165.55 | 174.42 |
| Pivot points | S3 | S2 | S1 | PP | R1 | R2 | R3 |
|---|---|---|---|---|---|---|---|
| Standard | 103.90 | 116.55 | 137.17 | 149.82 | 170.44 | 183.09 | 203.71 |
| Camarilla | 148.63 | 151.68 | 154.73 | 157.78 | 160.83 | 163.88 | 166.93 |
| Woodie | 107.88 | 118.54 | 141.15 | 151.81 | 174.42 | 185.08 | 207.69 |
| Fibonacci | 116.55 | 129.26 | 137.11 | 149.82 | 162.53 | 170.38 | 183.09 |
Numerical data
The following are the details of the technical indicators and moving averages that were collected to generate this technical analysis:
| RSI (14): | 57.70 | |
| MACD (12,26,9): | -0.6200 | |
| Directional Movement: | 10.47 | |
| AROON (14): | -50.00 | |
| DEMA (21): | 149.88 | |
| Parabolic SAR (0,02-0,02-0,2): | 137.17 | |
| Elder Ray (13): | 7.51 | |
| Super Trend (3,10): | 163.02 | |
| Zig ZAG (10): | 158.52 | |
| VORTEX (21): | 1.0600 | |
| Stochastique (14,3,5): | 37.44 | |
| TEMA (21): | 149.95 | |
| Williams %R (14): | -29.50 | |
| Chande Momentum Oscillator (20): | 2.27 | |
| Repulse (5,40,3): | 3.0000 | |
| ROCnROLL: | 1 | |
| TRIX (15,9): | 0.0100 | |
| Courbe Coppock: | 8.94 |
| MA7: | 146.54 | |
| MA20: | 153.29 | |
| MA50: | 149.49 | |
| MA100: | 165.73 | |
| MAexp7: | 149.64 | |
| MAexp20: | 150.57 | |
| MAexp50: | 153.69 | |
| MAexp100: | 161.83 | |
| Price / MA7: | +8.44% | |
| Price / MA20: | +3.67% | |
| Price / MA50: | +6.30% | |
| Price / MA100: | -4.12% | |
| Price / MAexp7: | +6.19% | |
| Price / MAexp20: | +5.54% | |
| Price / MAexp50: | +3.40% | |
| Price / MAexp100: | -1.80% |
News
Don't forget to follow the news on FIRST SOLAR INC.. At the time of publication of this analysis, the latest news was as follows:
- TotalEnergies ENEOS signs first solar rooftop project of Kinpo Group in the Philippines
- Thinking about trading options or stock in Tesla, Adobe, Meta Platforms, First Solar, or Davita?
- Thinking about trading options or stock in Microsoft, Macy's, Anheuser-Busch Inbev, Docusign, or First Solar?
- UbiQD Expands Collaboration with First Solar on Quantum Dot-Enhanced Solar Modules
- First Solar Establishes New Solar Industry Benchmark for Transparency with 2023 Sustainability Report
About author
Online


Add a comment
Comments
0 comments on the analysis FIRST SOLAR INC. - Daily