THE CIGNA GROUP overview
THE CIGNA GROUP
> Analyses

 Thank you
Reply
Chart
Thank you
Reply
Chart
Londinia
has published a new analysis.
- 0
- 89031
- 15458
- 0
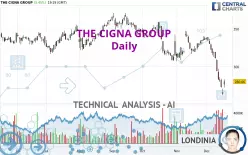
Timeframe : Daily - Simple chart
Status : LEVEL MAINTAINED
The bearish trend is currently very strong for THE CIGNA GROUP. As long as the price remains below the resistance at 292.14 USD, you could try to take advantage of the bearish rally. The first bearish…
THE CIGNA GROUP
> Analyses
 Thank you
Reply
Chart
Thank you
Reply
Chart
Londinia
has published a new analysis.
- 0
- 89031
- 15458
- 0
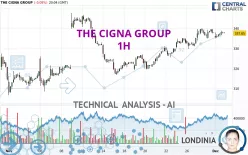
Timeframe : 1H - Simple chart
Status : INVALID
The bullish trend is currently very strong on THE CIGNA GROUP. As long as the price remains above the support at 335.01 USD, you could try to benefit from the boom. The first bullish objective is…
THE CIGNA GROUP
> Analyses
 Thank you
Reply
Chart
Thank you
Reply
Chart
Londinia
has published a new analysis.
- 0
- 89031
- 15458
- 0
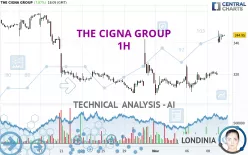
Timeframe : 1H - Simple chart
Status : INVALID
THE CIGNA GROUP is part of a very strong bullish trend. Traders may consider trading only long positions (at the time of purchase) as long as the price remains well above 341.86 USD. The next…

