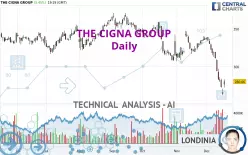
THE CIGNA GROUP - Daily - Technical analysis published on 12/18/2024 (GMT)
- 82
- 0
Click here for a new analysis!
- Timeframe : Daily
- - Analysis generated on
- Status : LEVEL MAINTAINED

Summary of the analysis

Additional analysis
Quotes
The THE CIGNA GROUP rating is 280.06 USD. On the day, this instrument gained +5.45% and was traded between 272.24 USD and 282.84 USD over the period. The price is currently at +2.87% from its lowest and -0.98% from its highest.Here is a more detailed summary of the historical variations registered by THE CIGNA GROUP:
Near a new LOW record (1 year)
Type : Bearish
Timeframe : Weekly
Near a new LOW record (1st january)
Type : Bearish
Timeframe : Weekly
Near a new LOW record (1 month)
Type : Bearish
Timeframe : Weekly
Technical
Technical analysis of this Daily chart of THE CIGNA GROUP indicates that the overall trend is strongly bearish. The signals given by moving averages are 92.86% bearish. This strong bearish trend is confirmed by the strong signals currently being given by short-term moving averages. The Central Indicators market scanner currently does not detect any result that concerns moving averages.
An assessment of technical indicators does not currently provide any relevant information to suggest whether the signal given by the technical indicators is more bullish or bearish.
Central Indicators, the detector scanner for these technical indicators recently detected a signal:
Pivot points : price is over resistance 3
Type : Neutral
Timeframe : Daily
No signals are given by Central Patterns, a market scanner specialised in chart patterns, resistances and supports.
For a small rebound in the very short term, the Central Candlesticks scanner currently notes the presence of these bullish patterns in Japanese candlesticks:
White morning star
Type : Bullish
Timeframe : Daily
Upside gap
Type : Bullish
Timeframe : Daily
Abandoned baby morning star
Type : Bullish
Timeframe : Daily
| S3 | S2 | S1 | Price | R1 | R2 | R3 | |
|---|---|---|---|---|---|---|---|
| ProTrendLines | 209.89 | 235.48 | 253.33 | 280.06 | 292.14 | 316.57 | 327.80 |
| Change (%) | -25.06% | -15.92% | -9.54% | - | +4.31% | +13.04% | +17.05% |
| Change | -70.17 | -44.58 | -26.73 | - | +12.08 | +36.51 | +47.74 |
| Level | Major | Intermediate | Intermediate | - | Intermediate | Intermediate | Major |
Pivot points can also be used to set your price objectives. Here is the price situation in relation to pivot points:
| Pivot points | S3 | S2 | S1 | PP | R1 | R2 | R3 |
|---|---|---|---|---|---|---|---|
| Standard | 252.87 | 257.45 | 261.52 | 266.10 | 270.17 | 274.75 | 278.82 |
| Camarilla | 263.21 | 264.00 | 264.80 | 265.59 | 266.38 | 267.18 | 267.97 |
| Woodie | 252.62 | 257.32 | 261.27 | 265.97 | 269.92 | 274.62 | 278.57 |
| Fibonacci | 257.45 | 260.75 | 262.80 | 266.10 | 269.40 | 271.45 | 274.75 |
| Pivot points | S3 | S2 | S1 | PP | R1 | R2 | R3 |
|---|---|---|---|---|---|---|---|
| Standard | 227.56 | 253.72 | 267.79 | 293.95 | 308.02 | 334.18 | 348.25 |
| Camarilla | 270.80 | 274.49 | 278.17 | 281.86 | 285.55 | 289.24 | 292.92 |
| Woodie | 221.52 | 250.70 | 261.75 | 290.93 | 301.98 | 331.16 | 342.21 |
| Fibonacci | 253.72 | 269.09 | 278.58 | 293.95 | 309.32 | 318.81 | 334.18 |
| Pivot points | S3 | S2 | S1 | PP | R1 | R2 | R3 |
|---|---|---|---|---|---|---|---|
| Standard | 271.77 | 288.57 | 312.56 | 329.36 | 353.35 | 370.15 | 394.14 |
| Camarilla | 325.32 | 329.06 | 332.80 | 336.54 | 340.28 | 344.02 | 347.76 |
| Woodie | 275.36 | 290.37 | 316.15 | 331.16 | 356.94 | 371.95 | 397.73 |
| Fibonacci | 288.57 | 304.16 | 313.78 | 329.36 | 344.95 | 354.57 | 370.15 |
Numerical data
The following is the status of technical indicators and moving averages registered at the time this technical analysis was created:
| RSI (14): | 30.98 | |
| MACD (12,26,9): | -13.7300 | |
| Directional Movement: | -24.45 | |
| AROON (14): | -92.86 | |
| DEMA (21): | 288.86 | |
| Parabolic SAR (0,02-0,02-0,2): | 309.68 | |
| Elder Ray (13): | -18.79 | |
| Super Trend (3,10): | 294.24 | |
| Zig ZAG (10): | 279.41 | |
| VORTEX (21): | 0.6900 | |
| Stochastique (14,3,5): | 9.84 | |
| TEMA (21): | 279.16 | |
| Williams %R (14): | -77.18 | |
| Chande Momentum Oscillator (20): | -56.24 | |
| Repulse (5,40,3): | -2.8300 | |
| ROCnROLL: | 2 | |
| TRIX (15,9): | -0.3200 | |
| Courbe Coppock: | 27.65 |
| MA7: | 284.04 | |
| MA20: | 313.09 | |
| MA50: | 321.28 | |
| MA100: | 333.61 | |
| MAexp7: | 284.80 | |
| MAexp20: | 304.16 | |
| MAexp50: | 318.51 | |
| MAexp100: | 326.47 | |
| Price / MA7: | -1.40% | |
| Price / MA20: | -10.55% | |
| Price / MA50: | -12.83% | |
| Price / MA100: | -16.05% | |
| Price / MAexp7: | -1.66% | |
| Price / MAexp20: | -7.92% | |
| Price / MAexp50: | -12.07% | |
| Price / MAexp100: | -14.22% |
News
The latest news and videos published on THE CIGNA GROUP at the time of the analysis were as follows:
- The Cigna Group Foundation Announces First Grantee Cohort of Health Equity Impact Fund
- The Cigna Group Affirming Its Capital Priorities
- The Cigna Group Reports Strong Third Quarter 2024 Results, Reaffirms 2024 Adjusted EPS Outlook
- The Cigna Group Declares Quarterly Dividend
- The Cigna Group's Third Quarter 2024 Earnings Release Details
About author
Online


Add a comment
Comments
0 comments on the analysis THE CIGNA GROUP - Daily