THE CIGNA GROUP - 1H - Technical analysis published on 12/02/2024 (GMT)
- 158
- 0
Click here for a new analysis!
- Timeframe : 1H
- - Analysis generated on
- Status : INVALID
Summary of the analysis

Additional analysis
Quotes
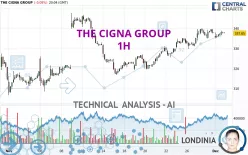
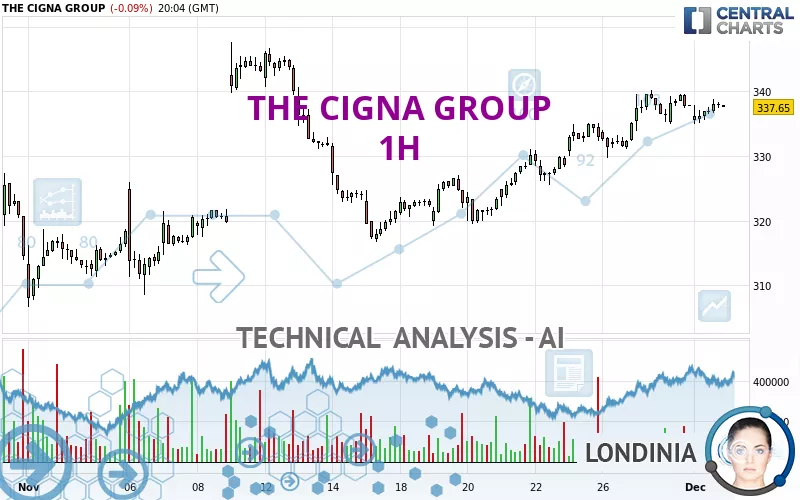
The THE CIGNA GROUP rating is 337.65 USD. The price registered a decrease of -0.09% on the session and was between 334.89 USD and 338.78 USD. This implies that the price is at +0.82% from its lowest and at -0.33% from its highest.A bearish opening was detected by the Central Gaps scanner. Sellers are trying to impose a bearish trend in the very short term.
Bearish opening
Type : Bearish
Timeframe : Openning
So that you have an overall view of the price change, here is a table showing the variations over several periods:
Near a new HIGH record (1 month)
Type : Bullish
Timeframe : Weekly
Technical
Technical analysis of this 1H chart of THE CIGNA GROUP indicates that the overall trend is strongly bullish. 82.14% of the signals given by moving averages are bullish. The overall trend is supported by the strong bullish signals from short-term moving averages. The Central Indicators scanner detects a bearish signal on moving averages that could impact this trend:
Bearish trend reversal : Moving Average 100
Type : Bearish
Timeframe : 1 hour
In fact, according to the parameters integrated into the Central Analyzer system, 10 technical indicators out of 18 analysed are currently bullish. No additional result has been identified by Central Indicators, the scanner specialised in technical indicators.
Central Patterns, the market scanner focusing on chart patterns, resistances and supports found these results:
Near horizontal resistance
Type : Bearish
Timeframe : 1 hour
Near resistance of triangle
Type : Bearish
Timeframe : 1 hour
Near support of channel
Type : Bullish
Timeframe : 1 hour
The presence of a bearish pattern in Japanese candlesticks detected by Central Candlesticks that could cause a correction in the very short term was also detected:
Bearish harami
Type : Bearish
Timeframe : 1 hour
| S3 | S2 | S1 | Price | R1 | R2 | R3 | |
|---|---|---|---|---|---|---|---|
| ProTrendLines | 325.85 | 329.18 | 335.01 | 337.65 | 343.19 | 347.62 | 354.35 |
| Change (%) | -3.49% | -2.51% | -0.78% | - | +1.64% | +2.95% | +4.95% |
| Change | -11.80 | -8.47 | -2.64 | - | +5.54 | +9.97 | +16.70 |
| Level | Minor | Major | Intermediate | - | Major | Minor | Minor |
To determine price objectives, it is also possible to use the pivot points. Here is the price position in relation to pivot points:
| Pivot points | S3 | S2 | S1 | PP | R1 | R2 | R3 |
|---|---|---|---|---|---|---|---|
| Standard | 330.85 | 332.93 | 335.44 | 337.52 | 340.03 | 342.11 | 344.62 |
| Camarilla | 336.69 | 337.11 | 337.53 | 337.95 | 338.37 | 338.79 | 339.21 |
| Woodie | 331.07 | 333.04 | 335.66 | 337.63 | 340.25 | 342.22 | 344.84 |
| Fibonacci | 332.93 | 334.68 | 335.77 | 337.52 | 339.27 | 340.36 | 342.11 |
| Pivot points | S3 | S2 | S1 | PP | R1 | R2 | R3 |
|---|---|---|---|---|---|---|---|
| Standard | 321.23 | 325.45 | 331.70 | 335.92 | 342.17 | 346.39 | 352.64 |
| Camarilla | 335.07 | 336.03 | 336.99 | 337.95 | 338.91 | 339.87 | 340.83 |
| Woodie | 322.25 | 325.96 | 332.72 | 336.43 | 343.19 | 346.90 | 353.66 |
| Fibonacci | 325.45 | 329.45 | 331.92 | 335.92 | 339.92 | 342.39 | 346.39 |
| Pivot points | S3 | S2 | S1 | PP | R1 | R2 | R3 |
|---|---|---|---|---|---|---|---|
| Standard | 272.91 | 289.78 | 313.87 | 330.74 | 354.83 | 371.70 | 395.79 |
| Camarilla | 326.69 | 330.44 | 334.20 | 337.95 | 341.71 | 345.46 | 349.21 |
| Woodie | 276.51 | 291.59 | 317.47 | 332.55 | 358.43 | 373.51 | 399.39 |
| Fibonacci | 289.78 | 305.43 | 315.10 | 330.74 | 346.39 | 356.06 | 371.70 |
Numerical data
The following is the status of the technical indicators and moving averages at the time of publication of this technical analysis:
| RSI (14): | 57.87 | |
| MACD (12,26,9): | 1.3500 | |
| Directional Movement: | 5.44 | |
| AROON (14): | -64.29 | |
| DEMA (21): | 338.54 | |
| Parabolic SAR (0,02-0,02-0,2): | 334.97 | |
| Elder Ray (13): | 0.78 | |
| Super Trend (3,10): | 332.64 | |
| Zig ZAG (10): | 337.62 | |
| VORTEX (21): | 1.1300 | |
| Stochastique (14,3,5): | 53.27 | |
| TEMA (21): | 338.11 | |
| Williams %R (14): | -36.52 | |
| Chande Momentum Oscillator (20): | 1.45 | |
| Repulse (5,40,3): | 0.2500 | |
| ROCnROLL: | 1 | |
| TRIX (15,9): | 0.0800 | |
| Courbe Coppock: | 0.33 |
| MA7: | 334.11 | |
| MA20: | 327.63 | |
| MA50: | 333.14 | |
| MA100: | 339.32 | |
| MAexp7: | 337.50 | |
| MAexp20: | 336.48 | |
| MAexp50: | 333.36 | |
| MAexp100: | 330.72 | |
| Price / MA7: | +1.06% | |
| Price / MA20: | +3.06% | |
| Price / MA50: | +1.35% | |
| Price / MA100: | -0.49% | |
| Price / MAexp7: | +0.04% | |
| Price / MAexp20: | +0.35% | |
| Price / MAexp50: | +1.29% | |
| Price / MAexp100: | +2.10% |
News
Don't forget to follow the news on THE CIGNA GROUP. At the time of publication of this analysis, the latest news was as follows:
- The Cigna Group Foundation Announces First Grantee Cohort of Health Equity Impact Fund
- The Cigna Group Affirming Its Capital Priorities
- The Cigna Group Reports Strong Third Quarter 2024 Results, Reaffirms 2024 Adjusted EPS Outlook
- The Cigna Group Declares Quarterly Dividend
- The Cigna Group's Third Quarter 2024 Earnings Release Details
About author
Online


Add a comment
Comments
0 comments on the analysis THE CIGNA GROUP - 1H