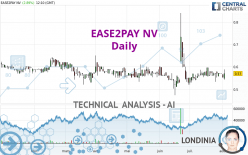
EASE2PAY NV - Daily - Technical analysis published on 08/02/2024 (GMT)
- 91
- 0
Click here for a new analysis!
- Timeframe : Daily
- - Analysis generated on
- Status : INVALID

Summary of the analysis

Additional analysis
Quotes
The EASE2PAY NV rating is 0.570 EUR. The price registered an increase of +2.89% on the session and was traded between 0.542 EUR and 0.588 EUR over the period. The price is currently at +5.17% from its lowest and -3.06% from its highest.A bearish gap was detected at the opening by the Central Gaps scanner. There are a lot of sellers and they have the upper hand in the very short term.
Opening Gap DOWN
Type : Bearish
Timeframe : Openning
A study of price movements over other periods shows the following variations:
Near a new LOW record (1 month)
Type : Bearish
Timeframe : Weekly
Technical
A technical analysis in Daily of this EASE2PAY NV chart shows a slightly bullish trend. 57.14% of the signals given by moving averages are bullish. The overall trend remains fragile, as do the slightly bullish signals given by short-term moving averages. The Central Indicators scanner detects bullish signals on moving averages that could impact this trend:
Bullish price crossover with Moving Average 20
Type : Bullish
Timeframe : Daily
Bullish price crossover with Moving Average 50
Type : Bullish
Timeframe : Daily
Bullish price crossover with Moving Average 100
Type : Bullish
Timeframe : Daily
In fact, 10 technical indicators on 18 studied are currently positioned bullish. Central Indicators, the detector scanner for these technical indicators has recently detected several signals:
Pivot points : price is over resistance 1
Type : Neutral
Timeframe : Daily
RSI indicator is back over 50
Type : Bullish
Timeframe : Daily
Ichimoku - Bullish crossover : Tenkan & Kijun
Type : Bullish
Timeframe : Daily
Price is back over the pivot point
Type : Bullish
Timeframe : Weekly
Momentum indicator is back over 0
Type : Bullish
Timeframe : Daily
Williams %R indicator is back over -50
Type : Bullish
Timeframe : Daily
The Central Patterns scanner, which studies chart patterns, resistances and supports, has identified these signals:
Horizontal support is broken
Type : Bearish
Timeframe : Daily
Support of channel is broken
Type : Bearish
Timeframe : Daily
For a small rebound in the very short term, the Central Candlesticks scanner currently notes the presence of this bullish pattern in Japanese candlesticks:
Bullish engulfing lines
Type : Bullish
Timeframe : Daily
| S2 | S1 | Price | R1 | R2 | R3 | |
|---|---|---|---|---|---|---|
| ProTrendLines | 0.520 | 0.551 | 0.570 | 0.600 | 0.636 | 0.752 |
| Change (%) | -8.77% | -3.33% | - | +5.26% | +11.58% | +31.93% |
| Change | -0.050 | -0.019 | - | +0.030 | +0.066 | +0.182 |
| Level | Minor | Major | - | Major | Minor | Minor |
Pivot points can also be used to set your price objectives. Here is the price situation in relation to pivot points:
| Pivot points | S3 | S2 | S1 | PP | R1 | R2 | R3 |
|---|---|---|---|---|---|---|---|
| Standard | 0.531 | 0.541 | 0.547 | 0.557 | 0.563 | 0.573 | 0.579 |
| Camarilla | 0.550 | 0.551 | 0.553 | 0.554 | 0.556 | 0.557 | 0.558 |
| Woodie | 0.530 | 0.540 | 0.546 | 0.556 | 0.562 | 0.572 | 0.578 |
| Fibonacci | 0.541 | 0.547 | 0.551 | 0.557 | 0.563 | 0.567 | 0.573 |
| Pivot points | S3 | S2 | S1 | PP | R1 | R2 | R3 |
|---|---|---|---|---|---|---|---|
| Standard | 0.493 | 0.513 | 0.541 | 0.561 | 0.589 | 0.609 | 0.637 |
| Camarilla | 0.557 | 0.561 | 0.566 | 0.570 | 0.574 | 0.579 | 0.583 |
| Woodie | 0.498 | 0.515 | 0.546 | 0.563 | 0.594 | 0.611 | 0.642 |
| Fibonacci | 0.513 | 0.531 | 0.542 | 0.561 | 0.579 | 0.590 | 0.609 |
| Pivot points | S3 | S2 | S1 | PP | R1 | R2 | R3 |
|---|---|---|---|---|---|---|---|
| Standard | 0.453 | 0.487 | 0.529 | 0.563 | 0.605 | 0.639 | 0.681 |
| Camarilla | 0.551 | 0.558 | 0.565 | 0.572 | 0.579 | 0.586 | 0.593 |
| Woodie | 0.458 | 0.489 | 0.534 | 0.565 | 0.610 | 0.641 | 0.686 |
| Fibonacci | 0.487 | 0.516 | 0.534 | 0.563 | 0.592 | 0.610 | 0.639 |
Numerical data
The following is the status of technical indicators and moving averages registered at the time this technical analysis was created:
| RSI (14): | 50.86 | |
| MACD (12,26,9): | 0.0010 | |
| Directional Movement: | 5.439 | |
| AROON (14): | -42.857 | |
| DEMA (21): | 0.568 | |
| Parabolic SAR (0,02-0,02-0,2): | 0.740 | |
| Elder Ray (13): | -0.003 | |
| Super Trend (3,10): | 0.628 | |
| Zig ZAG (10): | 0.570 | |
| VORTEX (21): | 0.9250 | |
| Stochastique (14,3,5): | 52.08 | |
| TEMA (21): | 0.569 | |
| Williams %R (14): | -40.63 | |
| Chande Momentum Oscillator (20): | 0.010 | |
| Repulse (5,40,3): | 3.3930 | |
| ROCnROLL: | 1 | |
| TRIX (15,9): | 0.0300 | |
| Courbe Coppock: | 0.58 |
| MA7: | 0.569 | |
| MA20: | 0.567 | |
| MA50: | 0.565 | |
| MA100: | 0.568 | |
| MAexp7: | 0.567 | |
| MAexp20: | 0.567 | |
| MAexp50: | 0.567 | |
| MAexp100: | 0.573 | |
| Price / MA7: | +0.18% | |
| Price / MA20: | +0.53% | |
| Price / MA50: | +0.88% | |
| Price / MA100: | +0.35% | |
| Price / MAexp7: | +0.53% | |
| Price / MAexp20: | +0.53% | |
| Price / MAexp50: | +0.53% | |
| Price / MAexp100: | -0.52% |
News
The last news published on EASE2PAY NV at the time of the generation of this analysis was as follows:
- EASE2PAY N.V. today publishes the 2021 annual report
- Ease2pay announces intended acquisition of Involtum and capital raise to accelerate growth
-
 DOCdata
About author
Online


Add a comment
Comments
0 comments on the analysis EASE2PAY NV - Daily