EASE2PAY NV - Daily - Technical analysis published on 03/20/2024 (GMT)
- 197
- 0
Click here for a new analysis!
- Timeframe : Daily
- - Analysis generated on
- Status : INVALID

Summary of the analysis

Additional analysis
Quotes
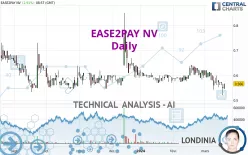
The EASE2PAY NV price is 0.566 EUR. The price has increased by +2.91% since the last closing and was between 0.546 EUR and 0.566 EUR. This implies that the price is at +3.66% from its lowest and at 0% from its highest.So that you have an overall view of the price change, here is a table showing the variations over several periods:
New LOW record (5 years)
Type : Bearish
Timeframe : Weekly
Near a new LOW record (1 year)
Type : Bearish
Timeframe : Weekly
Near a new LOW record (1st january)
Type : Bearish
Timeframe : Weekly
Near a new LOW record (1 month)
Type : Bearish
Timeframe : Weekly
Technical
Technical analysis of this Daily chart of EASE2PAY NV indicates that the overall trend is strongly bearish. 92.86% of the signals given by moving averages are bearish. The overall trend is supported by the strong bearish signals from short-term moving averages. There is no crossing of moving average by the price or crossing of moving averages between themselves.
An assessment of technical indicators does not currently provide any relevant information to suggest whether the signal given by the technical indicators is more bullish or bearish.
Caution: the Central Indicators scanner currently detects an excess:
CCI indicator is oversold : under -100
Type : Neutral
Timeframe : Daily
CCI indicator: bullish divergence
Type : Bullish
Timeframe : Daily
RSI indicator: bullish divergence
Type : Bullish
Timeframe : Daily
Price is back under the pivot point
Type : Bearish
Timeframe : Weekly
Central Patterns, the market scanner focusing on chart patterns, resistances and supports found these results:
Near horizontal support
Type : Bullish
Timeframe : Daily
Support of channel is broken
Type : Bearish
Timeframe : Daily
The presence of a bullish Japanese candlestick pattern detected by Central Candlesticks that could cause a very short term rebound was also detected:
Bullish engulfing lines
Type : Bullish
Timeframe : Daily
| S1 | Price | R1 | R2 | R3 | |
|---|---|---|---|---|---|
| ProTrendLines | 0.548 | 0.566 | 0.600 | 0.641 | 0.780 |
| Change (%) | -3.18% | - | +6.01% | +13.25% | +37.81% |
| Change | -0.018 | - | +0.034 | +0.075 | +0.214 |
| Level | Intermediate | - | Major | Minor | Major |
To determine price objectives, it is also possible to use the pivot points. Here is the price position in relation to pivot points:
| Pivot points | S3 | S2 | S1 | PP | R1 | R2 | R3 |
|---|---|---|---|---|---|---|---|
| Standard | 0.479 | 0.499 | 0.525 | 0.545 | 0.571 | 0.591 | 0.617 |
| Camarilla | 0.537 | 0.542 | 0.546 | 0.550 | 0.554 | 0.558 | 0.563 |
| Woodie | 0.481 | 0.501 | 0.527 | 0.547 | 0.573 | 0.593 | 0.619 |
| Fibonacci | 0.499 | 0.517 | 0.528 | 0.545 | 0.563 | 0.574 | 0.591 |
| Pivot points | S3 | S2 | S1 | PP | R1 | R2 | R3 |
|---|---|---|---|---|---|---|---|
| Standard | 0.481 | 0.511 | 0.537 | 0.567 | 0.593 | 0.623 | 0.649 |
| Camarilla | 0.547 | 0.552 | 0.557 | 0.562 | 0.567 | 0.572 | 0.577 |
| Woodie | 0.478 | 0.510 | 0.534 | 0.566 | 0.590 | 0.622 | 0.646 |
| Fibonacci | 0.511 | 0.533 | 0.546 | 0.567 | 0.589 | 0.602 | 0.623 |
| Pivot points | S3 | S2 | S1 | PP | R1 | R2 | R3 |
|---|---|---|---|---|---|---|---|
| Standard | 0.517 | 0.545 | 0.583 | 0.611 | 0.649 | 0.677 | 0.715 |
| Camarilla | 0.602 | 0.608 | 0.614 | 0.620 | 0.626 | 0.632 | 0.638 |
| Woodie | 0.521 | 0.548 | 0.587 | 0.614 | 0.653 | 0.680 | 0.719 |
| Fibonacci | 0.545 | 0.571 | 0.586 | 0.611 | 0.637 | 0.652 | 0.677 |
Numerical data
The following is the status of technical indicators and moving averages registered at the time this technical analysis was created:
| RSI (14): | 35.86 | |
| MACD (12,26,9): | -0.0130 | |
| Directional Movement: | -21.570 | |
| AROON (14): | -92.857 | |
| DEMA (21): | 0.566 | |
| Parabolic SAR (0,02-0,02-0,2): | 0.596 | |
| Elder Ray (13): | -0.027 | |
| Super Trend (3,10): | 0.623 | |
| Zig ZAG (10): | 0.546 | |
| VORTEX (21): | 0.7870 | |
| Stochastique (14,3,5): | 29.78 | |
| TEMA (21): | 0.555 | |
| Williams %R (14): | -74.00 | |
| Chande Momentum Oscillator (20): | -0.074 | |
| Repulse (5,40,3): | -0.3710 | |
| ROCnROLL: | 2 | |
| TRIX (15,9): | -0.1660 | |
| Courbe Coppock: | 17.17 |
| MA7: | 0.561 | |
| MA20: | 0.591 | |
| MA50: | 0.593 | |
| MA100: | 0.598 | |
| MAexp7: | 0.562 | |
| MAexp20: | 0.581 | |
| MAexp50: | 0.592 | |
| MAexp100: | 0.607 | |
| Price / MA7: | +0.89% | |
| Price / MA20: | -4.23% | |
| Price / MA50: | -4.55% | |
| Price / MA100: | -5.35% | |
| Price / MAexp7: | +0.71% | |
| Price / MAexp20: | -2.58% | |
| Price / MAexp50: | -4.39% | |
| Price / MAexp100: | -6.75% |
News
The last news published on EASE2PAY NV at the time of the generation of this analysis was as follows:
- EASE2PAY N.V. today publishes the 2021 annual report
- Ease2pay announces intended acquisition of Involtum and capital raise to accelerate growth
-
 DOCdata
About author
Online


Add a comment
Comments
0 comments on the analysis EASE2PAY NV - Daily