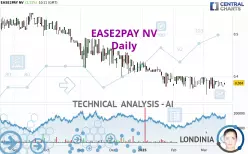
EASE2PAY NV - Daily - Technical analysis published on 03/21/2025 (GMT)
- 136
- 0
Click here for a new analysis!
- Timeframe : Daily
- - Analysis generated on
- Status : TARGET REACHED

Summary of the analysis

Additional analysis
Quotes
The EASE2PAY NV rating is 0.384 EUR. On the day, this instrument gained +2.13% and was traded between 0.380 EUR and 0.384 EUR over the period. The price is currently at +1.05% from its lowest and 0% from its highest.The Central Gaps scanner detects a bullish opening. A small advantage for buyers in the very short term.
Bullish opening
Type : Bullish
Timeframe : Openning
Here is a more detailed summary of the historical variations registered by EASE2PAY NV:
Near a new HIGH record (1 month)
Type : Bullish
Timeframe : Weekly
Technical
Technical analysis of this Daily chart of EASE2PAY NV indicates that the overall trend is bearish. 71.43% of the signals given by moving averages are bearish. Caution: as the signals currently given by short-term moving averages are rather neutral, the bearish trend could slow down. The Central Indicators scanner detects a bullish signal on moving averages that could impact this trend:
Bullish price crossover with Moving Average 20
Type : Bullish
Timeframe : Daily
The probability of a further increase is slight given the direction of the technical indicators.
Caution: the Central Indicators scanner currently detects an excess:
CCI indicator: bullish divergence
Type : Bullish
Timeframe : Daily
MACD indicator: bullish divergence
Type : Bullish
Timeframe : Daily
Pivot points : price is over resistance 3 (Daily)
Type : Neutral
Timeframe : Daily
Williams %R indicator is back over -50
Type : Bullish
Timeframe : Daily
The Central Patterns scanner, which studies chart patterns, resistances and supports, has identified this signal:
Near resistance of channel
Type : Bearish
Timeframe : Daily
The Central Candlesticks scanner which studies Japanese candlesticks did not detect anything.
| S2 | S1 | Price | R1 | R2 | R3 | |
|---|---|---|---|---|---|---|
| ProTrendLines | 0.243 | 0.371 | 0.384 | 0.511 | 0.596 | 0.734 |
| Change (%) | -36.72% | -3.39% | - | +33.07% | +55.21% | +91.15% |
| Change | -0.141 | -0.013 | - | +0.127 | +0.212 | +0.350 |
| Level | Intermediate | Intermediate | - | Major | Minor | Minor |
Pivot points can also be used to set your price objectives. Here is the price situation in relation to pivot points:
| Pivot points | S3 | S2 | S1 | PP | R1 | R2 | R3 |
|---|---|---|---|---|---|---|---|
| Standard | 0.371 | 0.373 | 0.375 | 0.377 | 0.379 | 0.381 | 0.383 |
| Camarilla | 0.375 | 0.375 | 0.376 | 0.376 | 0.376 | 0.377 | 0.377 |
| Woodie | 0.370 | 0.373 | 0.374 | 0.377 | 0.378 | 0.381 | 0.382 |
| Fibonacci | 0.373 | 0.375 | 0.376 | 0.377 | 0.379 | 0.380 | 0.381 |
| Pivot points | S3 | S2 | S1 | PP | R1 | R2 | R3 |
|---|---|---|---|---|---|---|---|
| Standard | 0.348 | 0.359 | 0.373 | 0.384 | 0.398 | 0.409 | 0.423 |
| Camarilla | 0.379 | 0.381 | 0.384 | 0.386 | 0.388 | 0.391 | 0.393 |
| Woodie | 0.349 | 0.360 | 0.374 | 0.385 | 0.399 | 0.410 | 0.424 |
| Fibonacci | 0.359 | 0.369 | 0.375 | 0.384 | 0.394 | 0.400 | 0.409 |
| Pivot points | S3 | S2 | S1 | PP | R1 | R2 | R3 |
|---|---|---|---|---|---|---|---|
| Standard | 0.345 | 0.358 | 0.375 | 0.388 | 0.405 | 0.418 | 0.435 |
| Camarilla | 0.385 | 0.388 | 0.390 | 0.393 | 0.396 | 0.399 | 0.401 |
| Woodie | 0.348 | 0.359 | 0.378 | 0.389 | 0.408 | 0.419 | 0.438 |
| Fibonacci | 0.358 | 0.369 | 0.376 | 0.388 | 0.399 | 0.406 | 0.418 |
Numerical data
The following is the status of the technical indicators and moving averages at the time of publication of this technical analysis:
| RSI (14): | 49.04 | |
| MACD (12,26,9): | -0.0030 | |
| Directional Movement: | -17.793 | |
| AROON (14): | -14.286 | |
| DEMA (21): | 0.379 | |
| Parabolic SAR (0,02-0,02-0,2): | 0.363 | |
| Elder Ray (13): | -0.001 | |
| Super Trend (3,10): | 0.419 | |
| Zig ZAG (10): | 0.384 | |
| VORTEX (21): | 0.9420 | |
| Stochastique (14,3,5): | 61.43 | |
| TEMA (21): | 0.382 | |
| Williams %R (14): | -30.00 | |
| Chande Momentum Oscillator (20): | -0.006 | |
| Repulse (5,40,3): | 1.0050 | |
| ROCnROLL: | -1 | |
| TRIX (15,9): | -0.1300 | |
| Courbe Coppock: | 2.80 |
| MA7: | 0.383 | |
| MA20: | 0.383 | |
| MA50: | 0.391 | |
| MA100: | 0.419 | |
| MAexp7: | 0.382 | |
| MAexp20: | 0.384 | |
| MAexp50: | 0.395 | |
| MAexp100: | 0.421 | |
| Price / MA7: | +0.26% | |
| Price / MA20: | +0.26% | |
| Price / MA50: | -1.79% | |
| Price / MA100: | -8.35% | |
| Price / MAexp7: | +0.52% | |
| Price / MAexp20: | -0% | |
| Price / MAexp50: | -2.78% | |
| Price / MAexp100: | -8.79% |
News
Don't forget to follow the news on EASE2PAY NV. At the time of publication of this analysis, the latest news was as follows:
- EASE2PAY N.V. today publishes the 2021 annual report
- Ease2pay announces intended acquisition of Involtum and capital raise to accelerate growth
-
 DOCdata
About author
Online


Add a comment
Comments
0 comments on the analysis EASE2PAY NV - Daily