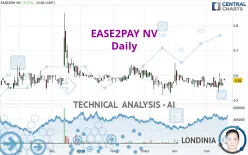
EASE2PAY NV - Daily - Technical analysis published on 05/20/2024 (GMT)
- 185
- 0
Click here for a new analysis!
- Timeframe : Daily
- - Analysis generated on
- Status : INVALID

Summary of the analysis

Additional analysis
Quotes
EASE2PAY NV rating 0.580 EUR. The price has increased by +3.57% since the last closing with the lowest point at 0.580 EUR and the highest point at 0.586 EUR. The deviation from the price is 0% for the low point and -1.02% for the high point.The Central Gaps scanner detects the formation of a bullish gap marking the strong presence of buyers against sellers at the opening. This formed a quotation gap.
Opening Gap UP
Type : Bullish
Timeframe : Openning
A study of price movements over other periods shows the following variations:
Near a new HIGH record (1 month)
Type : Bullish
Timeframe : Weekly
Technical
Technical analysis of this Daily chart of EASE2PAY NV indicates that the overall trend is slightly bearish. 57.14% of the signals given by moving averages are bearish. Caution: the strong bullish signals currently being given by short-term moving averages could quickly lead to a reversal of the trend. The Central Indicators scanner detects bullish signals on moving averages that could impact this trend:
Bullish price crossover with Moving Average 20
Type : Bullish
Timeframe : Daily
Bullish price crossover with Moving Average 50
Type : Bullish
Timeframe : Daily
In fact, 12 technical indicators on 18 studied are currently positioned bullish. Caution: the Central Indicators scanner currently detects an excess:
CCI indicator is overbought : over 100
Type : Neutral
Timeframe : Daily
MACD indicator: bullish divergence
Type : Bullish
Timeframe : Daily
Pivot points : price is over resistance 3
Type : Neutral
Timeframe : Daily
RSI indicator is back over 50
Type : Bullish
Timeframe : Daily
Momentum indicator is back over 0
Type : Bullish
Timeframe : Daily
Williams %R indicator is back over -50
Type : Bullish
Timeframe : Daily
The Central Patterns scanner, which studies chart patterns, resistances and supports, has identified these signals:
Near horizontal resistance
Type : Bearish
Timeframe : Daily
Resistance of channel is broken
Type : Bullish
Timeframe : Daily
Resistance of triangle is broken
Type : Bullish
Timeframe : Daily
The Central Candlesticks scanner which studies Japanese candlesticks did not detect anything.
| S1 | Price | R1 | R2 | R3 | |
|---|---|---|---|---|---|
| ProTrendLines | 0.550 | 0.580 | 0.600 | 0.636 | 0.680 |
| Change (%) | -5.17% | - | +3.45% | +9.66% | +17.24% |
| Change | -0.030 | - | +0.020 | +0.056 | +0.100 |
| Level | Intermediate | - | Major | Minor | Minor |
Attention could also be paid to pivot points to set price objectives:
| Pivot points | S3 | S2 | S1 | PP | R1 | R2 | R3 |
|---|---|---|---|---|---|---|---|
| Standard | 0.544 | 0.552 | 0.556 | 0.564 | 0.568 | 0.576 | 0.580 |
| Camarilla | 0.557 | 0.558 | 0.559 | 0.560 | 0.561 | 0.562 | 0.563 |
| Woodie | 0.542 | 0.551 | 0.554 | 0.563 | 0.566 | 0.575 | 0.578 |
| Fibonacci | 0.552 | 0.557 | 0.559 | 0.564 | 0.569 | 0.571 | 0.576 |
| Pivot points | S3 | S2 | S1 | PP | R1 | R2 | R3 |
|---|---|---|---|---|---|---|---|
| Standard | 0.447 | 0.489 | 0.525 | 0.567 | 0.603 | 0.645 | 0.681 |
| Camarilla | 0.539 | 0.546 | 0.553 | 0.560 | 0.567 | 0.574 | 0.582 |
| Woodie | 0.443 | 0.488 | 0.521 | 0.566 | 0.599 | 0.644 | 0.677 |
| Fibonacci | 0.489 | 0.519 | 0.538 | 0.567 | 0.597 | 0.616 | 0.645 |
| Pivot points | S3 | S2 | S1 | PP | R1 | R2 | R3 |
|---|---|---|---|---|---|---|---|
| Standard | 0.435 | 0.493 | 0.535 | 0.593 | 0.635 | 0.693 | 0.735 |
| Camarilla | 0.551 | 0.560 | 0.569 | 0.578 | 0.587 | 0.596 | 0.606 |
| Woodie | 0.428 | 0.489 | 0.528 | 0.589 | 0.628 | 0.689 | 0.728 |
| Fibonacci | 0.493 | 0.531 | 0.555 | 0.593 | 0.631 | 0.655 | 0.693 |
Numerical data
The following are the details of the technical indicators and moving averages that were collected to generate this technical analysis:
| RSI (14): | 52.96 | |
| MACD (12,26,9): | -0.0020 | |
| Directional Movement: | 6.249 | |
| AROON (14): | 7.142 | |
| DEMA (21): | 0.566 | |
| Parabolic SAR (0,02-0,02-0,2): | 0.611 | |
| Elder Ray (13): | 0.015 | |
| Super Trend (3,10): | 0.627 | |
| Zig ZAG (10): | 0.580 | |
| VORTEX (21): | 0.8960 | |
| Stochastique (14,3,5): | 55.56 | |
| TEMA (21): | 0.567 | |
| Williams %R (14): | -38.46 | |
| Chande Momentum Oscillator (20): | 0.020 | |
| Repulse (5,40,3): | -1.7280 | |
| ROCnROLL: | 1 | |
| TRIX (15,9): | -0.1000 | |
| Courbe Coppock: | 1.63 |
| MA7: | 0.567 | |
| MA20: | 0.568 | |
| MA50: | 0.573 | |
| MA100: | 0.586 | |
| MAexp7: | 0.570 | |
| MAexp20: | 0.569 | |
| MAexp50: | 0.576 | |
| MAexp100: | 0.589 | |
| Price / MA7: | +2.29% | |
| Price / MA20: | +2.11% | |
| Price / MA50: | +1.22% | |
| Price / MA100: | -1.02% | |
| Price / MAexp7: | +1.75% | |
| Price / MAexp20: | +1.93% | |
| Price / MAexp50: | +0.69% | |
| Price / MAexp100: | -1.53% |
News
The last news published on EASE2PAY NV at the time of the generation of this analysis was as follows:
- EASE2PAY N.V. today publishes the 2021 annual report
- Ease2pay announces intended acquisition of Involtum and capital raise to accelerate growth
-
 DOCdata
About author
Online


Add a comment
Comments
0 comments on the analysis EASE2PAY NV - Daily