Technical analyses - English
You are currently viewing all technical analyses regarding all markets in English regarding all markets, sorted by Latest comments.
Sort : Latest comments | Latest posted
- 0
- 92617
- 15739
- 0
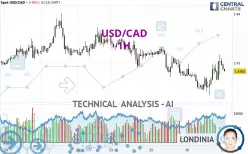
Timeframe : 1H - Simple chart
Status : IN PROGRESS...
- 0
- 92617
- 15739
- 0

Timeframe : 1H - Simple chart
Status : IN PROGRESS...
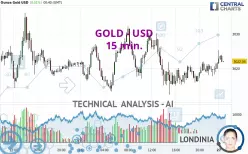
Timeframe : 15 min. - Simple chart
Status : IN PROGRESS...

Timeframe : Weekly - Simple chart
Status : IN PROGRESS...

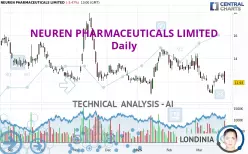
Timeframe : Daily - Simple chart
Status : IN PROGRESS...

Timeframe : Weekly - Simple chart
Status : IN PROGRESS...
Timeframe : Daily - Simple chart
Status : IN PROGRESS...

Timeframe : Daily - Simple chart
Status : IN PROGRESS...

Timeframe : Weekly - Simple chart
Status : IN PROGRESS...

Timeframe : 15 min. - Simple chart
Status : NEUTRAL

Timeframe : 15 min. - Simple chart
Status : IN PROGRESS...
- 0
- 92617
- 15739
- 0

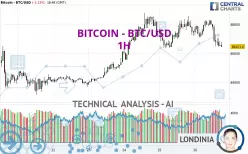
Timeframe : 1H - Simple chart
Status : IN PROGRESS...

Timeframe : 1H - Simple chart
Status : NEUTRAL
- 0
- 92617
- 15739
- 0

Timeframe : 1H - Simple chart
Status : IN PROGRESS...
- 0
- 92617
- 15739
- 0

Timeframe : Daily - Simple chart
Status : IN PROGRESS...
- 0
- 92617
- 15739
- 0

Timeframe : 1H - Simple chart
Status : IN PROGRESS...

Timeframe : 1H - Simple chart
Status : INVALID

Timeframe : 15 min. - Simple chart
Status : IN PROGRESS...
Timeframe : 1H - Simple chart
Status : IN PROGRESS...

Timeframe : 15 min. - Simple chart
Status : INVALID

