TOMPKINS FINANCIAL overview
TOMPKINS FINANCIAL
> Analyses

 Thank you
Reply
Chart
Thank you
Reply
Chart
Londinia
has published a new analysis.
- 0
- 93299
- 15787
- 0
Timeframe : Daily - Simple chart
Status : IN PROGRESS...
The bearish trend is currently very strong for TOMPKINS FINANCIAL. As long as the price remains below the resistance at , you could try to take advantage of the bearish rally. The first bearish…
TOMPKINS FINANCIAL
> Analyses
 Thank you
Reply
Chart
Thank you
Reply
Chart
Londinia
has published a new analysis.
- 0
- 93299
- 15787
- 0
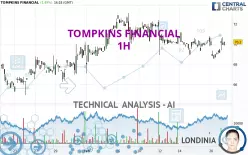
Timeframe : 1H - Simple chart
Status : TARGET REACHED
The bearish trend is currently very strong for TOMPKINS FINANCIAL. As long as the price remains below the resistance at 58.60 USD, you could try to take advantage of the bearish rally. The first…
TOMPKINS FINANCIAL
> Analyses
 Thank you
Reply
Chart
Thank you
Reply
Chart
Londinia
has published a new analysis.
- 0
- 93299
- 15787
- 0
Timeframe : 1H - Simple chart
Status : TARGET REACHED
The bearish trend is currently very strong for TOMPKINS FINANCIAL. As long as the price remains below the resistance at 63.82 USD, you could try to take advantage of the bearish rally. The first…
TOMPKINS FINANCIAL
> Analyses
 Thank you
Reply
Chart
Thank you
Reply
Chart
Londinia
has published a new analysis.
- 0
- 93299
- 15787
- 0
Timeframe : Daily - Simple chart
Status : TARGET REACHED
All elements being clearly bearish, it would be possible for traders to trade only short positions (for sale) on TOMPKINS FINANCIAL as long as the price remains well below 67.71 USD. The sellers'…
TOMPKINS FINANCIAL
> Analyses
 Thank you
Reply
Chart
Thank you
Reply
Chart
Londinia
has published a new analysis.
- 0
- 93299
- 15787
- 0
Timeframe : 1H - Simple chart
Status : INVALID
All elements being clearly bullish, it would be possible for traders to trade only long positions (at the time of purchase) on TOMPKINS FINANCIAL as long as the price remains well above 63.08 USD. The…
TOMPKINS FINANCIAL
> Analyses
 Thank you
Reply
Chart
Thank you
Reply
Chart
Londinia
has published a new analysis.
- 0
- 93299
- 15787
- 0
Timeframe : 1H - Simple chart
Status : NEUTRAL
A slightly bearish trend and a neutral short term. With such a pattern, it is difficult to favour buying or selling. The first support is located at 63.02 USD. The first resistance is located at…
TOMPKINS FINANCIAL
> Analyses
 Thank you
Reply
Chart
Thank you
Reply
Chart
Londinia
has published a new analysis.
- 0
- 93299
- 15787
- 0
Timeframe : 1H - Simple chart
Status : INVALID
The bullish trend is truly tentative and does not seem to be supported in the short term. It is advisable to trade TOMPKINS FINANCIAL with the greatest caution, while favouring long positions (at the…

