| Open: | - |
| Change: | - |
| Volume: | - |
| Low: | - |
| High: | - |
| High / Low range: | - |
| Type: | ETF |
| Ticker: | APA |
| ISIN: | AU000000APA1 |
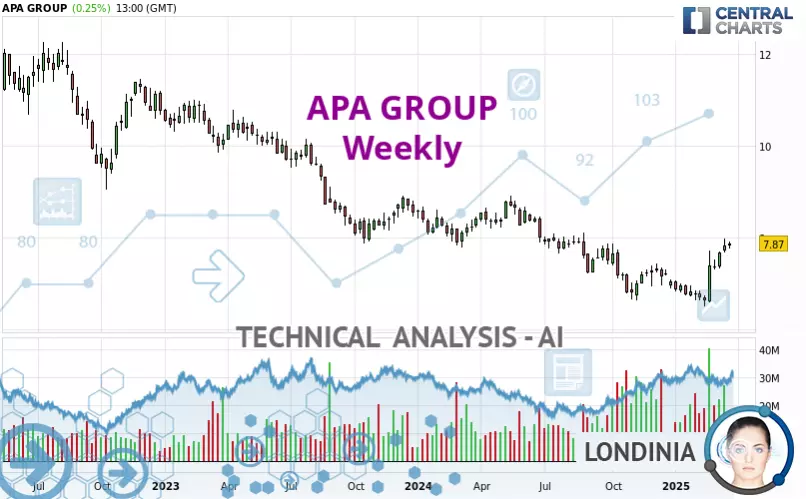
APA GROUP - Weekly - Technical analysis published on 03/27/2025 (GMT)
- 71
- 0
- 03/27/2025 - 00:10
- Timeframe : Weekly
- - Analysis generated on 03/27/2025 - 00:10
- Status : IN PROGRESS...

Summary of the analysis

Additional analysis
Quotes
APA GROUP rating 7.870 AUD. The price registered an increase of +0.13% over 5 days and has been traded over the last 5 days between 7.760 AUD and 7.910 AUD. This implies that the 5 day price is +1.42% from its lowest point and -0.51% from its highest point.A bearish opening was detected by the Central Gaps scanner. Sellers are trying to impose a bearish trend in the very short term.
Bearish opening
Type : Bearish
Timeframe : Openning
Here is a more detailed summary of the historical variations registered by APA GROUP:
Near a new HIGH record (1st january)
Type : Bullish
Timeframe : Weekly
Near a new HIGH record (1 month)
Type : Bullish
Timeframe : Weekly
Technical
A technical analysis in Weekly of this APA GROUP chart shows a slightly bearish trend. 57.14% of the signals given by moving averages are bearish. Caution: the strong bullish signals currently being given by short-term moving averages indicate that this slightly bearish trend could quickly be reversed. The Central Indicators scanner detects a bullish signal on moving averages that could impact this trend:
Bullish price crossover with adaptative moving average 100
Type : Bullish
Timeframe : Weekly
In fact, 15 technical indicators on 18 studied are currently bullish. But beware of excesses. The Central Indicators scanner currently detects this:
CCI indicator is overbought : over 100
Type : Neutral
Timeframe : Weekly
Williams %R indicator is overbought : over -20
Type : Neutral
Timeframe : Weekly
MACD indicator is back over 0
Type : Bullish
Timeframe : Weekly
Price is back over the pivot point (Daily)
Type : Bullish
Timeframe : Weekly
Pivot points : price is over resistance 3 (Weekly)
Type : Neutral
Timeframe : Weekly
Pivot points : price is over resistance 3 (Monthly)
Type : Neutral
Timeframe : Weekly
No signals are given by Central Patterns, a market scanner specialised in chart patterns, resistances and supports.
No result was found by the Central Candlesticks scanner on Japanese candlesticks.
| S3 | S2 | S1 | Price | R1 | R2 | R3 | |
|---|---|---|---|---|---|---|---|
| ProTrendLines | 5.270 | 6.632 | 7.270 | 7.870 | 8.161 | 9.218 | 10.420 |
| Change (%) | -33.04% | -15.73% | -7.62% | - | +3.70% | +17.13% | +32.40% |
| Change | -2.600 | -1.238 | -0.600 | - | +0.291 | +1.348 | +2.550 |
| Level | Minor | Major | Major | - | Minor | Major | Minor |
To determine price objectives, it is also possible to use the pivot points. Here is the price position in relation to pivot points:
| Pivot points | S3 | S2 | S1 | PP | R1 | R2 | R3 |
|---|---|---|---|---|---|---|---|
| Standard | 7.733 | 7.777 | 7.823 | 7.867 | 7.913 | 7.957 | 8.003 |
| Camarilla | 7.845 | 7.854 | 7.862 | 7.870 | 7.878 | 7.887 | 7.895 |
| Woodie | 7.735 | 7.778 | 7.825 | 7.868 | 7.915 | 7.958 | 8.005 |
| Fibonacci | 7.777 | 7.811 | 7.832 | 7.867 | 7.901 | 7.922 | 7.957 |
| Pivot points | S3 | S2 | S1 | PP | R1 | R2 | R3 |
|---|---|---|---|---|---|---|---|
| Standard | 7.377 | 7.523 | 7.667 | 7.813 | 7.957 | 8.103 | 8.247 |
| Camarilla | 7.730 | 7.757 | 7.783 | 7.810 | 7.837 | 7.863 | 7.890 |
| Woodie | 7.375 | 7.523 | 7.665 | 7.813 | 7.955 | 8.103 | 8.245 |
| Fibonacci | 7.523 | 7.634 | 7.703 | 7.813 | 7.924 | 7.993 | 8.103 |
| Pivot points | S3 | S2 | S1 | PP | R1 | R2 | R3 |
|---|---|---|---|---|---|---|---|
| Standard | 5.470 | 5.980 | 6.680 | 7.190 | 7.890 | 8.400 | 9.100 |
| Camarilla | 7.047 | 7.158 | 7.269 | 7.380 | 7.491 | 7.602 | 7.713 |
| Woodie | 5.565 | 6.028 | 6.775 | 7.238 | 7.985 | 8.448 | 9.195 |
| Fibonacci | 5.980 | 6.442 | 6.728 | 7.190 | 7.652 | 7.938 | 8.400 |
Numerical data
The following is the status of technical indicators and moving averages registered at the time this technical analysis was created:
| RSI (14): | 62.65 | |
| MACD (12,26,9): | 0.0180 | |
| Directional Movement: | 10.243 | |
| AROON (14): | 28.571 | |
| DEMA (21): | 7.225 | |
| Parabolic SAR (0,02-0,02-0,2): | 6.595 | |
| Elder Ray (13): | 0.522 | |
| Super Trend (3,10): | 6.874 | |
| Zig ZAG (10): | 7.870 | |
| VORTEX (21): | 1.1500 | |
| Stochastique (14,3,5): | 93.73 | |
| TEMA (21): | 7.447 | |
| Williams %R (14): | -6.12 | |
| Chande Momentum Oscillator (20): | 0.840 | |
| Repulse (5,40,3): | 5.7180 | |
| ROCnROLL: | 1 | |
| TRIX (15,9): | -0.2830 | |
| Courbe Coppock: | 7.48 |
| MA7: | 7.857 | |
| MA20: | 7.642 | |
| MA50: | 7.151 | |
| MA100: | 7.104 | |
| MAexp7: | 7.478 | |
| MAexp20: | 7.281 | |
| MAexp50: | 7.570 | |
| MAexp100: | 8.164 | |
| Price / MA7: | +0.17% | |
| Price / MA20: | +2.98% | |
| Price / MA50: | +10.05% | |
| Price / MA100: | +10.78% | |
| Price / MAexp7: | +5.24% | |
| Price / MAexp20: | +8.09% | |
| Price / MAexp50: | +3.96% | |
| Price / MAexp100: | -3.60% |
News
The last news published on APA GROUP at the time of the generation of this analysis was as follows:
- 03/01/2021 - 16:00 APA Investor Alert: Bronstein, Gewirtz & Grossman, LLC Notifies Apache Corporation Investors of Class Action and Encourages Shareholders to Contact the Firm
- 02/26/2021 - 20:00 INVESTOR ALERT: Law Offices of Howard G. Smith Announces the Filing of a Securities Class Action on Behalf of Apache Corporation (APA) Investors
- 02/26/2021 - 17:30 Glancy Prongay & Murray LLP, a Leading Securities Fraud Law Firm, Announces the Filing of a Securities Class Action on Behalf of Apache Corporation (APA) Investors
- 02/26/2021 - 16:00 The Law Offices of Frank R. Cruz Announces the Filing of a Securities Class Action on Behalf of Apache Corporation (APA) Investors
- 02/25/2021 - 20:07 Shareholder Alert: Robbins LLP is Investigating Apache Corporation (APA) on Behalf of Shareholders
About author

Online


Add a comment
Comments
0 comments on the analysis APA GROUP - Weekly