Technical analyses - GOLDMAN SACHS GROUP INC. THE - English
You are currently viewing all technical analyses of the financial instrument GOLDMAN SACHS GROUP INC. THE regarding all markets in English regarding all markets, sorted by Latest comments.
Sort : Latest comments | Latest posted
- 0
- 95598
- 15833
- 0
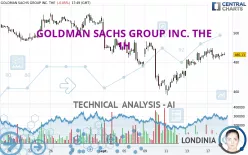
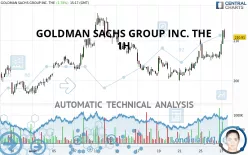
Timeframe : 1H - Simple chart
Status : TARGET REACHED
- 0
- 95598
- 15833
- 0

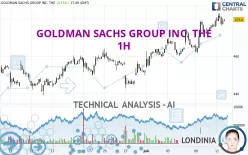
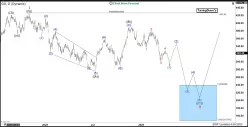
Timeframe : 1H - Simple chart
Status : INVALID
- 0
- 95598
- 15833
- 0

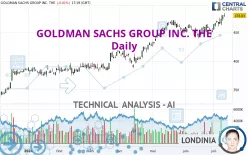
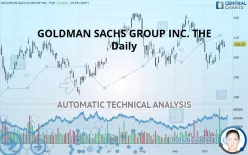
Timeframe : Daily - Simple chart
Status : WITHOUT TARGET
- 0
- 95598
- 15833
- 0
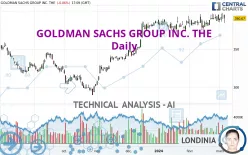
Timeframe : 1H - Simple chart
Status : TARGET REACHED
- 0
- 95598
- 15833
- 0
Timeframe : Daily - Simple chart
Status : TARGET REACHED
- 0
- 95598
- 15833
- 0
Timeframe : Daily - Simple chart
Status : TARGET REACHED
- 0
- 95598
- 15833
- 0
Timeframe : 1H - Simple chart
Status : INVALID
- 0
- 95598
- 15833
- 0
Timeframe : 1H - Simple chart
Status : INVALID
- 0
- 95598
- 15833
- 0
Timeframe : Daily - Simple chart
Status : LEVEL MAINTAINED
- 0
- 95598
- 15833
- 0
Timeframe : 1H - Simple chart
Status : INVALID
- 0
- 95598
- 15833
- 0
Timeframe : Daily - Simple chart
Status : TARGET REACHED
- 0
- 95598
- 15833
- 0

Timeframe : Daily - Simple chart
Status : NEUTRAL
- 21
- 92
- 270
- 94

Timeframe : Weekly - Simple chart
- 100
- 836
- 1878
- 0

Timeframe : Daily - Simple chart


