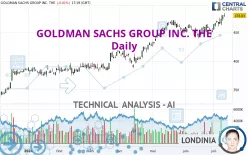
GOLDMAN SACHS GROUP INC. THE - Daily - Technical analysis published on 07/11/2024 (GMT)
- 167
- 0
Click here for a new analysis!
- Timeframe : Daily
- - Analysis generated on
- Status : TARGET REACHED

Summary of the analysis

Additional analysis
Quotes
GOLDMAN SACHS GROUP INC. THE rating 478.83 USD. On the day, this instrument lost -0.01% and was between 476.27 USD and 483.16 USD. This implies that the price is at +0.54% from its lowest and at -0.90% from its highest.The Central Gaps scanner detects the formation of a bullish gap marking the strong presence of buyers against sellers at the opening. This formed a quotation gap.
Opening Gap UP
Type : Bullish
Timeframe : Openning
A study of price movements over other periods shows the following variations:
New HIGH record (5 years)
Type : Bullish
Timeframe : Weekly
New HIGH record (1 year)
Type : Bullish
Timeframe : Weekly
New HIGH record (1st january)
Type : Bullish
Timeframe : Weekly
New HIGH record (1 month)
Type : Bullish
Timeframe : Weekly
Technical
Technical analysis of this Daily chart of GOLDMAN SACHS GROUP INC. THE indicates that the overall trend is strongly bullish. 92.86% of the signals given by moving averages are bullish. This strongly bullish trend is supported by the strong bullish signals given by short-term moving averages. There is no crossing of moving average by the price or crossing of moving averages between themselves.
The probability of a further increase is high given the direction of the technical indicators.
But beware of excesses. The Central Indicators scanner currently detects this:
CCI indicator is overbought : over 100
Type : Neutral
Timeframe : Daily
Williams %R indicator is overbought : over -20
Type : Neutral
Timeframe : Daily
Pivot points : price is over resistance 1
Type : Neutral
Timeframe : Weekly
An analysis of the price chart with the Central Patterns scanner (detector of chart patterns and resistances and supports) shows a result that can have an impact on the price change:
Resistance of channel is broken
Type : Bullish
Timeframe : Daily
The Central Candlesticks scanner which studies Japanese candlesticks did not detect anything.
| S3 | S2 | S1 | Price | |
|---|---|---|---|---|
| ProTrendLines | 395.97 | 445.40 | 467.58 | 478.83 |
| Change (%) | -17.30% | -6.98% | -2.35% | - |
| Change | -82.86 | -33.43 | -11.25 | - |
| Level | Major | Major | Major | - |
Pivot points can also be used to set your price objectives. Here is the price situation in relation to pivot points:
| Pivot points | S3 | S2 | S1 | PP | R1 | R2 | R3 |
|---|---|---|---|---|---|---|---|
| Standard | 462.53 | 466.19 | 472.54 | 476.20 | 482.55 | 486.21 | 492.56 |
| Camarilla | 476.14 | 477.06 | 477.97 | 478.89 | 479.81 | 480.73 | 481.64 |
| Woodie | 463.88 | 466.86 | 473.89 | 476.87 | 483.90 | 486.88 | 493.91 |
| Fibonacci | 466.19 | 470.01 | 472.38 | 476.20 | 480.02 | 482.39 | 486.21 |
| Pivot points | S3 | S2 | S1 | PP | R1 | R2 | R3 |
|---|---|---|---|---|---|---|---|
| Standard | 440.00 | 447.00 | 455.88 | 462.88 | 471.76 | 478.76 | 487.64 |
| Camarilla | 460.38 | 461.84 | 463.29 | 464.75 | 466.21 | 467.66 | 469.12 |
| Woodie | 440.93 | 447.47 | 456.81 | 463.35 | 472.69 | 479.23 | 488.57 |
| Fibonacci | 447.00 | 453.07 | 456.82 | 462.88 | 468.95 | 472.70 | 478.76 |
| Pivot points | S3 | S2 | S1 | PP | R1 | R2 | R3 |
|---|---|---|---|---|---|---|---|
| Standard | 414.10 | 426.63 | 439.47 | 452.00 | 464.84 | 477.37 | 490.21 |
| Camarilla | 445.34 | 447.67 | 449.99 | 452.32 | 454.65 | 456.97 | 459.30 |
| Woodie | 414.27 | 426.71 | 439.64 | 452.08 | 465.01 | 477.45 | 490.38 |
| Fibonacci | 426.63 | 436.32 | 442.31 | 452.00 | 461.69 | 467.68 | 477.37 |
Numerical data
The following are the details of the technical indicators and moving averages that were collected to generate this technical analysis:
| RSI (14): | 65.04 | |
| MACD (12,26,9): | 6.4100 | |
| Directional Movement: | 13.77 | |
| AROON (14): | 64.29 | |
| DEMA (21): | 470.35 | |
| Parabolic SAR (0,02-0,02-0,2): | 455.65 | |
| Elder Ray (13): | 13.71 | |
| Super Trend (3,10): | 451.82 | |
| Zig ZAG (10): | 477.98 | |
| VORTEX (21): | 1.0800 | |
| Stochastique (14,3,5): | 89.19 | |
| TEMA (21): | 472.03 | |
| Williams %R (14): | -11.82 | |
| Chande Momentum Oscillator (20): | 16.02 | |
| Repulse (5,40,3): | 1.0700 | |
| ROCnROLL: | 1 | |
| TRIX (15,9): | 0.1300 | |
| Courbe Coppock: | 7.51 |
| MA7: | 470.45 | |
| MA20: | 459.36 | |
| MA50: | 454.62 | |
| MA100: | 426.19 | |
| MAexp7: | 471.00 | |
| MAexp20: | 462.63 | |
| MAexp50: | 450.36 | |
| MAexp100: | 429.89 | |
| Price / MA7: | +1.78% | |
| Price / MA20: | +4.24% | |
| Price / MA50: | +5.33% | |
| Price / MA100: | +12.35% | |
| Price / MAexp7: | +1.66% | |
| Price / MAexp20: | +3.50% | |
| Price / MAexp50: | +6.32% | |
| Price / MAexp100: | +11.38% |
News
Don't forget to follow the news on GOLDMAN SACHS GROUP INC. THE. At the time of publication of this analysis, the latest news was as follows:
- Goldman Sachs BDC, Inc. Schedules Earnings Release and Conference Call to Announce Third Quarter 2019 Results
- Patient Access Solutions, Inc. COO, Dr. Donald Chiappetta Exclusive Interview on StockTradersTalk.com
- Patient Access Solutions, Inc. Announces Director of Behavioral Health
- Patient Access Solutions Inc. to Acquire Healthcare Practice
- Patient Access Solutions, Inc. Updates Shareholders
About author
Online


Add a comment
Comments
0 comments on the analysis GOLDMAN SACHS GROUP INC. THE - Daily