Technical analyses - ENGIE - English
You are currently viewing all technical analyses of the financial instrument ENGIE regarding all markets in English regarding all markets, sorted by Latest comments.
Sort : Latest comments | Latest posted
ENGIE
> Analyses

 Thank you
Reply
Chart
Thank you
Reply
Chart
Londinia
has published a new analysis.
- 0
- 96895
- 15906
- 0
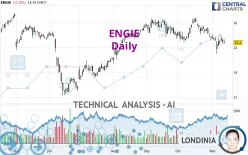
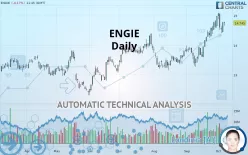
Timeframe : Daily - Simple chart
Status : LEVEL MAINTAINED
ENGIE is part of a very strong bearish trend. Traders may consider trading only short positions (for sale) as long as the price remains well below 15.864 EUR. The next support located at 14.280 EUR is…
ENGIE
> Analyses
 Thank you
Reply
Chart
Thank you
Reply
Chart
Londinia
has published a new analysis.
- 0
- 96895
- 15906
- 0
Timeframe : Daily - Simple chart
Status : TARGET REACHED
The current short-term bearish acceleration registered on ENGIE should quickly allow the basic trend to return to a bearish trend. To avoid contradicting the short term, traders could favour short…
ENGIE
> Analyses
 Thank you
Reply
Chart
Thank you
Reply
Chart
Londinia
has published a new analysis.
- 0
- 96895
- 15906
- 0
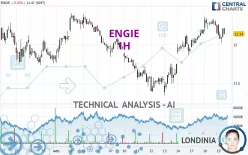
Timeframe : 1H - Simple chart
Status : TARGET REACHED
Has the basic bullish trend slowed or is it lacking in power? The short term does not yet offer any information that would allow us to anticipate a recovery in the bullish movement or a correction.…
ENGIE
> Analyses
 Thank you
Reply
Chart
Thank you
Reply
Chart
Londinia
has published a new analysis.
- 0
- 96895
- 15906
- 0
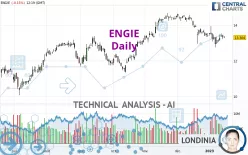
Timeframe : Daily - Simple chart
Status : INVALID
The basic bullish trend is very strong on ENGIE but the short term shows some signs of running out of steam. However, a purchase could be considered as long as the price remains above 12.352 EUR.…
ENGIE
> Analyses
 Thank you
Reply
Chart
Thank you
Reply
Chart
Londinia
has published a new analysis for Vincent Launay.
- 0
- 96895
- 15906
- 0
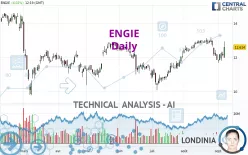
Timeframe : Daily - Simple chart
Status : TARGET REACHED
ENGIE is part of a very strong bullish trend. Traders may consider trading only long positions (at the time of purchase) as long as the price remains well above 14.306 EUR. The next resistance located…
ENGIE
> Analyses

 Thank you
Reply
Chart
Thank you
Reply
Chart
tasciccac has published a new analysis.
- 22
- 92
- 270
- 94
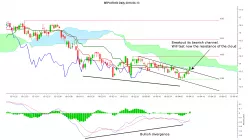
Timeframe : Daily - Simple chart
After a double bottom the prices move in a bearish channel. Today an attempt to exit by the top of this channel is done.
Now prices will be able to test the resistance of the cloud

