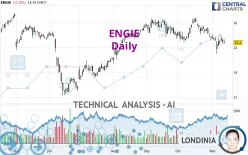
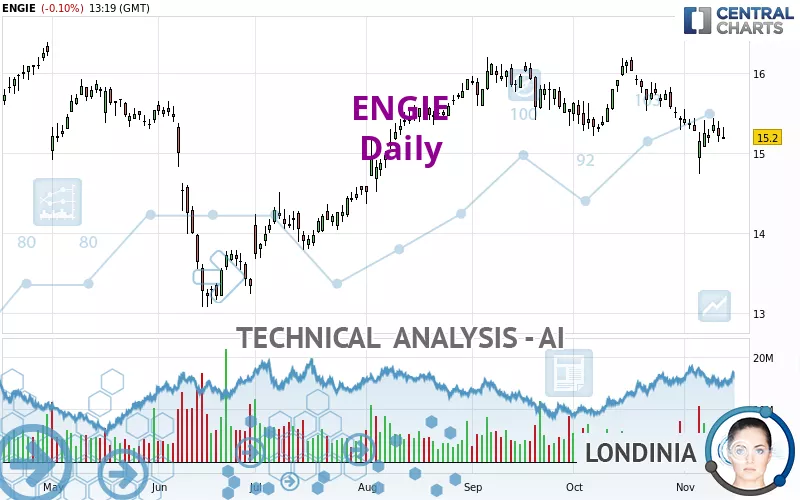
ENGIE - Daily - Technical analysis published on 11/13/2024 (GMT)
- 125
- 0
Click here for a new analysis!
- Timeframe : Daily
- - Analysis generated on
- Status : LEVEL MAINTAINED
Summary of the analysis

Additional analysis
Quotes
ENGIE rating 15.200 EUR. The price is lower by -0.10% since the last closing and was traded between 15.175 EUR and 15.325 EUR over the period. The price is currently at +0.16% from its lowest and -0.82% from its highest.The Central Gaps scanner detects a bearish opening. A small advantage for sellers in the very short term.
Bearish opening
Type : Bearish
Timeframe : Openning
A study of price movements over other periods shows the following variations:
Near a new HIGH record (5 years)
Type : Bullish
Timeframe : Weekly
Near a new LOW record (1 month)
Type : Bearish
Timeframe : Weekly
Technical
Technical analysis of ENGIE in Daily shows an overall bearish trend. 67.86% of the signals given by moving averages are bearish. The overall trend is reinforced by the strong bearish signals from short-term moving averages. The Central Indicators scanner detects a bearish signal on moving averages that could impact this trend:
Bearish price crossover with Moving Average 100
Type : Bearish
Timeframe : Daily
An assessment of technical indicators does not currently provide any relevant information to suggest whether the signal given by the technical indicators is more bullish or bearish.
The Central Indicators scanner found this result concerning these indicators:
Ichimoku : price is under the cloud
Type : Bearish
Timeframe : Daily
Central Patterns, the market scanner focusing on chart patterns, resistances and supports found these results:
Near support of channel
Type : Bullish
Timeframe : Daily
Near support of triangle
Type : Bullish
Timeframe : Daily
No result was found by the Central Candlesticks scanner on Japanese candlesticks.
| S3 | S2 | S1 | Price | R1 | R2 | |
|---|---|---|---|---|---|---|
| ProTrendLines | 13.908 | 14.280 | 15.095 | 15.200 | 15.864 | 16.349 |
| Change (%) | -8.50% | -6.05% | -0.69% | - | +4.37% | +7.56% |
| Change | -1.292 | -0.920 | -0.105 | - | +0.664 | +1.149 |
| Level | Minor | Intermediate | Major | - | Intermediate | Major |
Pivot points can also be used to set your price objectives. Here is the price situation in relation to pivot points:
| Pivot points | S3 | S2 | S1 | PP | R1 | R2 | R3 |
|---|---|---|---|---|---|---|---|
| Standard | 14.843 | 14.992 | 15.103 | 15.252 | 15.363 | 15.512 | 15.623 |
| Camarilla | 15.144 | 15.167 | 15.191 | 15.215 | 15.239 | 15.263 | 15.287 |
| Woodie | 14.825 | 14.983 | 15.085 | 15.243 | 15.345 | 15.503 | 15.605 |
| Fibonacci | 14.992 | 15.091 | 15.152 | 15.252 | 15.351 | 15.412 | 15.512 |
| Pivot points | S3 | S2 | S1 | PP | R1 | R2 | R3 |
|---|---|---|---|---|---|---|---|
| Standard | 14.102 | 14.418 | 14.802 | 15.118 | 15.502 | 15.818 | 16.202 |
| Camarilla | 14.993 | 15.057 | 15.121 | 15.185 | 15.249 | 15.313 | 15.378 |
| Woodie | 14.135 | 14.435 | 14.835 | 15.135 | 15.535 | 15.835 | 16.235 |
| Fibonacci | 14.418 | 14.686 | 14.851 | 15.118 | 15.386 | 15.551 | 15.818 |
| Pivot points | S3 | S2 | S1 | PP | R1 | R2 | R3 |
|---|---|---|---|---|---|---|---|
| Standard | 14.028 | 14.622 | 15.018 | 15.612 | 16.008 | 16.602 | 16.998 |
| Camarilla | 15.143 | 15.234 | 15.324 | 15.415 | 15.506 | 15.597 | 15.687 |
| Woodie | 13.930 | 14.573 | 14.920 | 15.563 | 15.910 | 16.553 | 16.900 |
| Fibonacci | 14.622 | 15.000 | 15.234 | 15.612 | 15.990 | 16.224 | 16.602 |
Numerical data
The following is the status of technical indicators and moving averages registered at the time this technical analysis was created:
| RSI (14): | 38.71 | |
| MACD (12,26,9): | -0.1300 | |
| Directional Movement: | -15.023 | |
| AROON (14): | -64.286 | |
| DEMA (21): | 15.276 | |
| Parabolic SAR (0,02-0,02-0,2): | 15.435 | |
| Elder Ray (13): | -0.101 | |
| Super Trend (3,10): | 15.686 | |
| Zig ZAG (10): | 15.195 | |
| VORTEX (21): | 0.7940 | |
| Stochastique (14,3,5): | 45.87 | |
| TEMA (21): | 15.158 | |
| Williams %R (14): | -57.80 | |
| Chande Momentum Oscillator (20): | -0.545 | |
| Repulse (5,40,3): | -0.6340 | |
| ROCnROLL: | 2 | |
| TRIX (15,9): | -0.0900 | |
| Courbe Coppock: | 6.83 |
| MA7: | 15.231 | |
| MA20: | 15.511 | |
| MA50: | 15.657 | |
| MA100: | 15.203 | |
| MAexp7: | 15.268 | |
| MAexp20: | 15.426 | |
| MAexp50: | 15.485 | |
| MAexp100: | 15.303 | |
| Price / MA7: | -0.20% | |
| Price / MA20: | -2.01% | |
| Price / MA50: | -2.92% | |
| Price / MA100: | -0.02% | |
| Price / MAexp7: | -0.45% | |
| Price / MAexp20: | -1.47% | |
| Price / MAexp50: | -1.84% | |
| Price / MAexp100: | -0.67% |
News
The last news published on ENGIE at the time of the generation of this analysis was as follows:
- ENGIE and Meta announce 260 MW renewable energy agreement
- ENGIE announces Power Purchase Agreement with Google – Will supply power from its largest U.S. solar project to date
- San Marcos Unified School District Unveils District-Wide Fleet Electrification Transportation Center with Energy Infrastructure and Upgrades with ENGIE
- ENGIE reaches more than 1.8 GW of Battery Energy Storage Systems installed capacity in the U.S., of which 1 GW added since January 2024
- ENGIE enters a partnership with Ares Management for a 2.7 GW portfolio of Renewables and Storage Assets in the U.S.
About author
Online


Add a comment
Comments
0 comments on the analysis ENGIE - Daily