EDISON INTERNATIONAL
> Analyses

 Thank you
Reply
Chart
Thank you
Reply
Chart
tasciccac has published a new analysis.
- 21
- 93
- 272
- 94
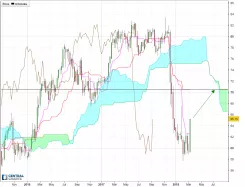
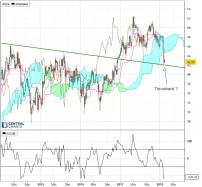
Timeframe : Weekly - Chart + Trading signal
After a bearish acceleration below the #Ichimoku cloud, the prices have stabilized, and they could have formed an accumulation area. The closure of this week confirm the bullish breakout of Tenkan…
FIGEAC AERO
> Analyses
Thank you
Reply
Chart
LOREAL
> Analyses
 Thank you
Reply
Chart
Thank you
Reply
Chart
tasciccac has published a new analysis.
- 21
- 93
- 272
- 94
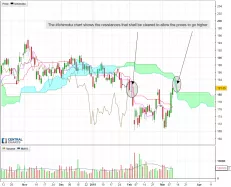
Timeframe : Daily - Simple chart
After the formation of a double bottom, the prices will now be in front of two #Ichimoku resistances, the cloud (Thin) & in the same time Chikou in front of a falling Tenkan Sen + Kijun Sen.
VANTIVA
> Analyses
Thank you
Reply
Chart
SAINT GOBAIN
> Analyses
 Thank you
Reply
Chart
Thank you
Reply
Chart
tasciccac has published a new analysis.
- 21
- 93
- 272
- 94
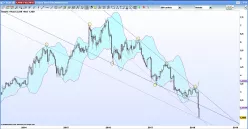
Timeframe : Weekly - Simple chart
The prices returns at the contact with an old bearish trend line passing by the top of the years 2014 & 2015. After being a resistance this line could become a support.
BITCOIN - BTC/USD
> Analyses
 Thank you
Reply
Chart
Thank you
Reply
Chart
tasciccac has published a new analysis.
- 21
- 93
- 272
- 94
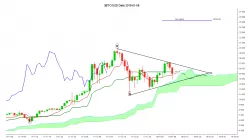
Timeframe : Daily - Chart + Trading signal
The price of the king of the cryptocurrencies evolve since some days into a symmetrical triangle, a classic consolidation pattern in a bullish trend. The odds are for an exit by the top.
A test of…
IBEX35 INDEX
> Analyses
 Thank you
Reply
Chart
Thank you
Reply
Chart
tasciccac has published a new analysis.
- 21
- 93
- 272
- 94
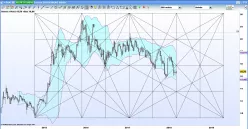
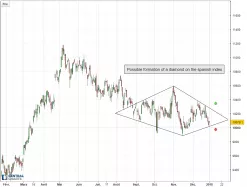
Timeframe : Daily - Simple chart
The exit of this diamond will allow us to know if it is a continuation diamond or a trend reversal diamond.
VALLOUREC
> Analyses
Thank you
Reply
Chart
BITCOIN - BTC/USD
> Analyses
 Thank you
Reply
Chart
Thank you
Reply
Chart
tasciccac has published a new analysis.
- 21
- 93
- 272
- 94
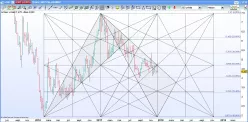
Timeframe : Weekly - Simple chart
The evolution of the prices is in rocket mode, but the RSI 14 weeks will evolve near a bearish trend line.
A consolidation is possible and will be healthy for the continuation of the bullish trend.


