NETFLIX INC.
> Analyses

 Thank you
Reply
Chart
Thank you
Reply
Chart
tasciccac has published a new analysis.
- 21
- 93
- 272
- 94
Timeframe : Weekly - Chart + Trading signal
During the last semester of 2018 the prices consolidate a multi year bullish move. Going from 423 to 231. After one year and a half evolving inside this range the prices seem to go higher…

THALES
> Analyses
 Thank you
Reply
Chart
Thank you
Reply
Chart
tasciccac has published a new analysis.
- 21
- 93
- 272
- 94
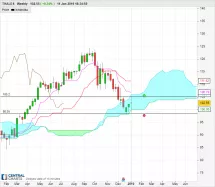
Timeframe : Weekly - Chart + One way trading
After a successful test of the bottom of the #Ichimoku cloud, we had this week a long legged doji inside the cloud showing the neutrality
Below the cloud, the actual bearish trend could continue,…
GOLDMAN SACHS GROUP INC. THE
> Analyses
 Thank you
Reply
Chart
Thank you
Reply
Chart
tasciccac has published a new analysis.
- 21
- 93
- 272
- 94
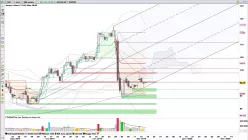
Timeframe : Weekly - Simple chart
The candles cross the #Ichimoku weekly cloud the end of May, and after a low in July, the prices stay capped by the cloud.
Last week we can see a shooting star testing the cloud, and this week a…
SODEXO
> Analyses
 Thank you
Reply
Chart
Thank you
Reply
Chart
tasciccac has published a new analysis.
- 21
- 93
- 272
- 94
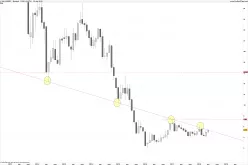
Timeframe : Weekly - Simple chart
Since the end of the year 2017 the prices evolve inside a bearish channel, the 5th contact point with this channel will be to watch closely in the coming weeks. I will try to find a swing trading plan…
VALLOUREC
> Analyses
Thank you
Reply
Chart

DERICHEBOURG
> Analyses
Thank you
Reply
Chart