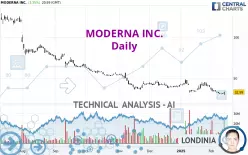
MODERNA INC. - Daily - Technical analysis published on 02/18/2025 (GMT)
- 78
- 0
- Timeframe : Daily
- - Analysis generated on
- Status : IN PROGRESS...

Summary of the analysis

Additional analysis
Quotes
MODERNA INC. rating 32.99 USD. The price has increased by +3.35% since the last closing and was between 29.25 USD and 33.91 USD. This implies that the price is at +12.79% from its lowest and at -2.71% from its highest.The Central Gaps scanner detects a bearish opening. A small advantage for sellers in the very short term.
Bearish opening
Type : Bearish
Timeframe : Openning
So that you have an overall view of the price change, here is a table showing the variations over several periods:
New LOW record (5 years)
Type : Bearish
Timeframe : Weekly
New LOW record (1 year)
Type : Bearish
Timeframe : Weekly
New LOW record (1st january)
Type : Bearish
Timeframe : Weekly
New LOW record (1 month)
Type : Bearish
Timeframe : Weekly
The Central Volumes scanner notes the presence of abnormal volumes:
Abnormal volumes
Timeframe : 5 days
Abnormal volumes
Timeframe : 20 days
Abnormal volumes
Timeframe : 50 days
Technical
Technical analysis of this Daily chart of MODERNA INC. indicates that the overall trend is strongly bearish. The signals given by moving averages are 92.86% bearish. This strong bearish trend is confirmed by the strong signals currently being given by short-term moving averages. The Central Indicators market scanner currently does not detect any result that concerns moving averages.
An assessment of technical indicators does not currently provide any relevant information on the direction of future price movements.
Central Indicators, the scanner specialised in technical indicators, has identified this signal:
Pivot points : price is over resistance 1
Type : Neutral
Timeframe : Daily
Central Patterns, the scanner specializing in chart patterns, did not identify any signals.
No result was found by the Central Candlesticks scanner on Japanese candlesticks.
| Price | R1 | R2 | R3 | |
|---|---|---|---|---|
| ProTrendLines | 32.99 | 45.05 | 80.10 | 116.47 |
| Change (%) | - | +36.56% | +142.80% | +253.05% |
| Change | - | +12.06 | +47.11 | +83.48 |
| Level | - | Major | Minor | Major |
To determine price objectives, it is also possible to use the pivot points. Here is the price position in relation to pivot points:
| Pivot points | S3 | S2 | S1 | PP | R1 | R2 | R3 |
|---|---|---|---|---|---|---|---|
| Standard | 25.54 | 27.40 | 30.19 | 32.05 | 34.84 | 36.70 | 39.49 |
| Camarilla | 31.71 | 32.14 | 32.56 | 32.99 | 33.42 | 33.84 | 34.27 |
| Woodie | 26.02 | 27.63 | 30.67 | 32.28 | 35.32 | 36.93 | 39.97 |
| Fibonacci | 27.40 | 29.17 | 30.27 | 32.05 | 33.82 | 34.92 | 36.70 |
| Pivot points | S3 | S2 | S1 | PP | R1 | R2 | R3 |
|---|---|---|---|---|---|---|---|
| Standard | 24.30 | 28.38 | 30.49 | 34.57 | 36.68 | 40.76 | 42.87 |
| Camarilla | 30.90 | 31.47 | 32.03 | 32.60 | 33.17 | 33.74 | 34.30 |
| Woodie | 23.32 | 27.89 | 29.51 | 34.08 | 35.70 | 40.27 | 41.89 |
| Fibonacci | 28.38 | 30.75 | 32.21 | 34.57 | 36.94 | 38.40 | 40.76 |
| Pivot points | S3 | S2 | S1 | PP | R1 | R2 | R3 |
|---|---|---|---|---|---|---|---|
| Standard | 14.29 | 23.11 | 31.27 | 40.09 | 48.25 | 57.07 | 65.23 |
| Camarilla | 34.75 | 36.31 | 37.86 | 39.42 | 40.98 | 42.53 | 44.09 |
| Woodie | 13.95 | 22.95 | 30.93 | 39.93 | 47.91 | 56.91 | 64.89 |
| Fibonacci | 23.11 | 29.60 | 33.61 | 40.09 | 46.58 | 50.59 | 57.07 |
Numerical data
The following is the status of the technical indicators and moving averages at the time of publication of this technical analysis:
| RSI (14): | 41.16 | |
| MACD (12,26,9): | -2.3300 | |
| Directional Movement: | -2.98 | |
| AROON (14): | -92.86 | |
| DEMA (21): | 32.58 | |
| Parabolic SAR (0,02-0,02-0,2): | 40.44 | |
| Elder Ray (13): | -2.58 | |
| Super Trend (3,10): | 38.27 | |
| Zig ZAG (10): | 32.99 | |
| VORTEX (21): | 0.9000 | |
| Stochastique (14,3,5): | 12.25 | |
| TEMA (21): | 31.62 | |
| Williams %R (14): | -76.48 | |
| Chande Momentum Oscillator (20): | -7.73 | |
| Repulse (5,40,3): | 9.6500 | |
| ROCnROLL: | 2 | |
| TRIX (15,9): | -0.6400 | |
| Courbe Coppock: | 36.22 |
| MA7: | 32.06 | |
| MA20: | 36.51 | |
| MA50: | 39.11 | |
| MA100: | 45.75 | |
| MAexp7: | 32.73 | |
| MAexp20: | 35.41 | |
| MAexp50: | 39.60 | |
| MAexp100: | 49.02 | |
| Price / MA7: | +2.90% | |
| Price / MA20: | -9.64% | |
| Price / MA50: | -15.65% | |
| Price / MA100: | -27.89% | |
| Price / MAexp7: | +0.79% | |
| Price / MAexp20: | -6.83% | |
| Price / MAexp50: | -16.69% | |
| Price / MAexp100: | -32.70% |
News
The last news published on MODERNA INC. at the time of the generation of this analysis was as follows:
- Moderna Reports Fourth Quarter and Fiscal Year 2024 Financial Results and Provides Business Updates
- Moderna to Report Fourth Quarter and Full Year 2024 Financial Results on Friday, February 14, 2025
- Moderna Awarded Tender for the Supply of Its mRNA COVID-19 Vaccine in the European Union
- Moderna Announces Updates on Pandemic Influenza Program
- Moderna Provides Business and Pipeline Updates at 43rd Annual J.P. Morgan Healthcare Conference
About author

Online


Add a comment
Comments
0 comments on the analysis MODERNA INC. - Daily